

Human dendritic cells following Aspergillus fumigatus infection express the CCR7 receptor and a differential pattern of interleukin-12 (IL-12), IL-23, and IL-27 cytokines, which lead to a Th1 response
- PMID: 16495518
- PMCID: PMC1418673
- DOI: 10.1128/IAI.74.3.1480-1489.2006
Human dendritic cells following Aspergillus fumigatus infection express the CCR7 receptor and a differential pattern of interleukin-12 (IL-12), IL-23, and IL-27 cytokines, which lead to a Th1 response
Abstract
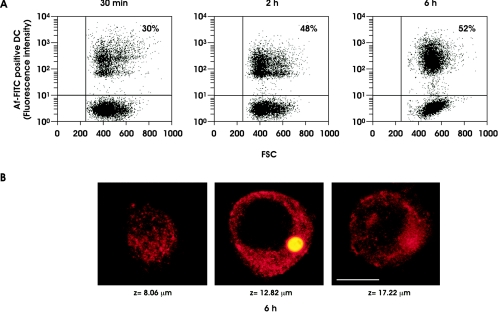
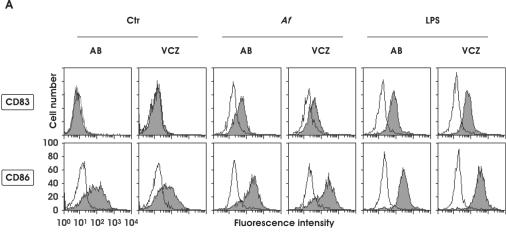
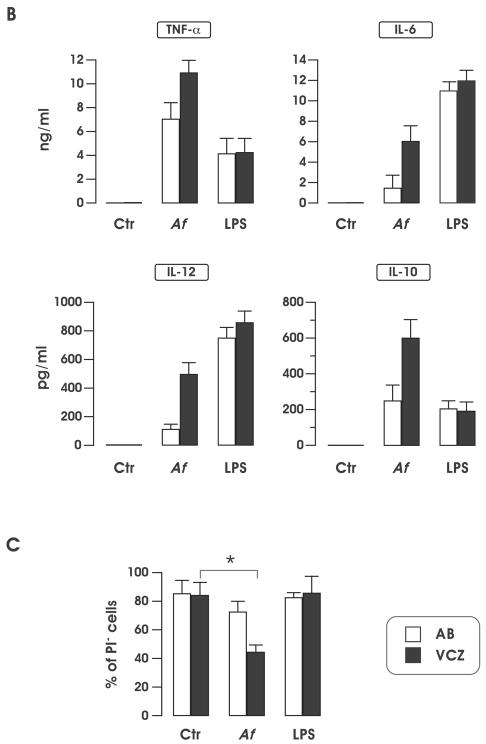
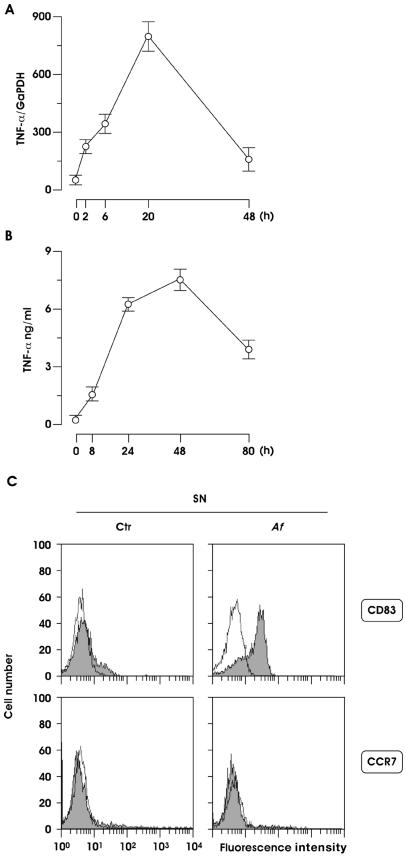
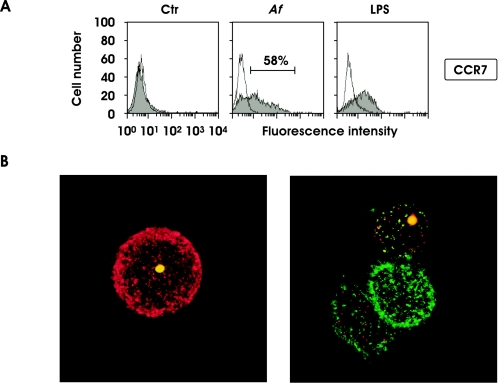
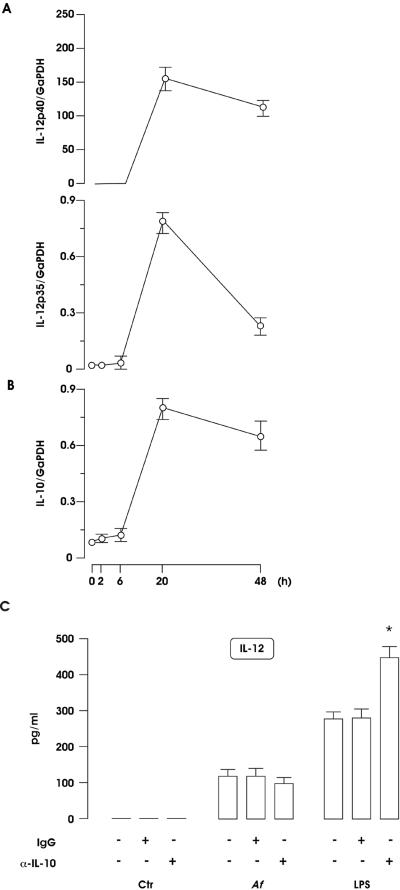
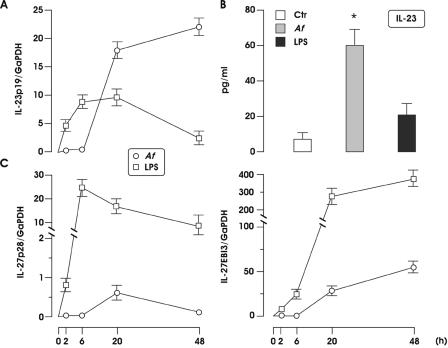
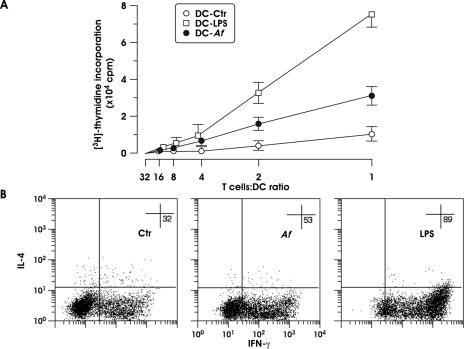
Aspergillus fumigatus is the most prevalent airborne fungal pathogen and causes fatal invasive aspergillosis in immunocompromised patients. Given the essential role of dendritic cells (DC) in initiating and regulating immune responses, we investigated the impact of A. fumigatus conidial infection on human DC. A. fumigatus conidia were rapidly internalized and induced the release of tumor necrosis factor alpha within the first 8 h. After A. fumigatus infection, the majority of DC underwent full maturation, although CCR7 expression was observed only in DC that had internalized the conidia. Additionally, the analysis of regulatory cytokines showed that infected DC simultaneously produced interleukin-12p70 (IL-12p70) and significant amounts of IL-10. IL-10 neutralization was not able to further increase IL-12p70 production from infected DC. Whereas the central role of IL-12 in the generation of Th1 cells has long been appreciated, recently two other members of the IL-12 family, IL-23 and IL-27, were reported to play important roles in the regulation of gamma interferon (IFN-gamma) production from naïve and memory T cells. A. fumigatus-infected DC were also able to express high levels of IL-23p19 and low levels of IL-27p28 at later stages of infection. According to this expression pattern, A. fumigatus-infected DC were able to prime IFN-gamma production of naïve T cells. Thus, this study on the expression of the new IL-12 family members controlling the Th1 response sheds light on a novel aspect of the contribution of DC to anti-Aspergillus immunity.
Figures
Similar articles
-
IL-6 produced by type I IFN DC controls IFN-gamma production by regulating the suppressive effect of CD4+ CD25+ regulatory T cells.Hum Immunol. 2005 May;66(5):460-8. doi: 10.1016/j.humimm.2005.01.012. Epub 2005 Feb 26. Hum Immunol. 2005. PMID: 15935883
-
CCR7 deficiency on dendritic cells enhances fungal clearance in a murine model of pulmonary invasive aspergillosis.J Immunol. 2009 Oct 15;183(8):5171-9. doi: 10.4049/jimmunol.0901027. Epub 2009 Sep 25. J Immunol. 2009. PMID: 19783686
-
Complement C5a anaphylatoxin is an innate determinant of dendritic cell-induced Th1 immunity to Mycobacterium bovis BCG infection in mice.J Leukoc Biol. 2007 Oct;82(4):956-67. doi: 10.1189/jlb.0206119. Epub 2007 Aug 3. J Leukoc Biol. 2007. PMID: 17675563
-
Effects of IL-12 and IL-23 on antigen-presenting cells at the interface between innate and adaptive immunity.Crit Rev Immunol. 2002;22(5-6):373-90. Crit Rev Immunol. 2002. PMID: 12803317 Review.
-
Immune responses to Aspergillus fumigatus infections.Biol Blood Marrow Transplant. 2006 Jan;12(1 Suppl 1):47-9. doi: 10.1016/j.bbmt.2005.09.007. Biol Blood Marrow Transplant. 2006. PMID: 16399584 Review.
Cited by
-
Respiratory dendritic cells: mediators of tolerance and immunity.Immunol Res. 2007;39(1-3):128-45. doi: 10.1007/s12026-007-0077-0. Immunol Res. 2007. PMID: 17917061 Review.
-
Coevolution of TH1, TH2, and TH17 responses during repeated pulmonary exposure to Aspergillus fumigatus conidia.Infect Immun. 2011 Jan;79(1):125-35. doi: 10.1128/IAI.00508-10. Epub 2010 Nov 1. Infect Immun. 2011. PMID: 21041495 Free PMC article.
-
Gene expression profiles of human dendritic cells interacting with Aspergillus fumigatus in a bilayer model of the alveolar epithelium/endothelium interface.PLoS One. 2014 May 28;9(5):e98279. doi: 10.1371/journal.pone.0098279. eCollection 2014. PLoS One. 2014. PMID: 24870357 Free PMC article.
-
The temporal dynamics of differential gene expression in Aspergillus fumigatus interacting with human immature dendritic cells in vitro.PLoS One. 2011 Jan 14;6(1):e16016. doi: 10.1371/journal.pone.0016016. PLoS One. 2011. PMID: 21264256 Free PMC article.
-
IL-23 promotes TCR-mediated negative selection of thymocytes through the upregulation of IL-23 receptor and RORγt.Nat Commun. 2014 Jul 8;5:4259. doi: 10.1038/ncomms5259. Nat Commun. 2014. PMID: 25001511 Free PMC article.
References
-
- Aste-Amezaga, M., X. Ma, A. Sartori, and G. Trinchieri. 1998. Molecular mechanisms of the induction of IL-12 and its inhibition by IL-10. J. Immunol. 160:5936-5944. - PubMed
-
- Banchereau, J., and R. M. Steinman. 1998. Dendritic cells and the control of immunity. Nature 392:245-252. - PubMed
-
- Bozza, S., R. Gaziano, A. Spreca, A. Bacci, C. Montagnoli, P. di Francesco, and L. Romani. 2002. Dendritic cells transport conidia and hyphae of Aspergillus fumigatus from the airways to the draining lymph nodes and initiate disparate Th responses to the fungus. J. Immunol. 168:1362-1371. - PubMed
-
- Bozza, S., K. Perruccio, C. Montagnoli, R. Gaziano, S. Bellocchio, E. Burchielli, G. Nkwanyuo, L. Pitzurra, A. Velardi, and L. Romani. 2003. A dendritic cell vaccine against invasive aspergillosis in allogeneic hematopoietic transplantation. Blood 102:3807-3814. - PubMed
-
- Braedel, S., M. Radsak, H. Einsele, J. P. Latge, A. Michan, J. Loeffler, Z. Haddad, U. Grigoleit, H. Schild, and H. Hebart. 2004. Aspergillus fumigatus antigens activate innate immune cells via toll-like receptors 2 and 4. Br. J. Haematol. 125:392-399. - PubMed
Publication types
MeSH terms
Substances
LinkOut - more resources
Full Text Sources
Other Literature Sources
Medical
