. 2006 Mar;74(3):1516-27.
doi: 10.1128/IAI.74.3.1516-1527.2006.

The proinflammatory response induced by wild-type Yersinia pseudotuberculosis infection inhibits survival of yop mutants in the gastrointestinal tract and Peyer's patches

Affiliations

The proinflammatory response induced by wild-type Yersinia pseudotuberculosis infection inhibits survival of yop mutants in the gastrointestinal tract and Peyer's patches

Lauren K Logsdon et al. Infect Immun. 2006 Mar.

Abstract

Single-strain infections and coinfections are frequently used to assess roles of virulence factors in infected tissues. After oral inoculation of mice, Yersinia pseudotuberculosis yopE and yopH mutants colonize the intestines and Peyer's patches in single-strain infections but fail to persist in competition with wild-type Y. pseudotuberculosis, indicating that these two infection models provide different insights into the roles of Yops. To determine how wild-type Y. pseudotuberculosis hinders yop mutant survival, yop mutant colonization and host responses were investigated in several different infection models that isolated specific features of wild-type Y. pseudotuberculosis infection. Infection with wild-type Y. pseudotuberculosis caused significantly more inflammation than yop mutants. Results from coinfections of gamma interferon (IFN-gamma)-/- mice revealed that IFN-gamma-regulated defenses target these mutants, suggesting that YopE and YopH protect Y. pseudotuberculosis from these defenses in BALB/c mice. We developed an oral-intraperitoneal infection model to evaluate the effects of spleen and liver colonization by Y. pseudotuberculosis on yop mutants in the intestines. Spleen and liver infection increased inflammation and decreased yop mutant survival in the intestines, indicating that infection of these organs has consequences in intestinal tissues. Finally, competition infections with Y. pseudotuberculosis mutants with various abilities to induce inflammation demonstrated that survival of the yopE, but not the yopH, mutant was consistently decreased in inflamed tissues. In summary, infection with Y. pseudotuberculosis in intestinal and systemic sites induces intestinal inflammation, which decreases yop mutant survival. Thus, competition studies with wild-type yersiniae reveal critical roles of Yops in combating host responses to a normal virulent infection.


Figures
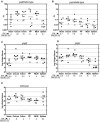
FIG. 1.
FIG. 1.
IFN-γ responses inhibit yopE and yopH mutants in the intestines during competition infections with wild-type Y. pseudotuberculosis. IFN-γ−/− mice were infected with equal mixtures of wild-type Y. pseudotuberculosis and the yopE mutant (A) or the yopH mutant (B) or with yopE (C), yopH (D), or wild-type (E) bacteria. The CIs (A and B) or colonization levels (C to E) were determined 5 days postinoculation. CI = (yop mutant/wild type)output/(yop mutant/wild type)input. The symbol × denotes the levels of colonization or CI previously reported in BALB/c mice (30). Each symbol represents data from one mouse, and bars indicate geometric means of the CIs or the average for the log CFU/g of tissue. The n-fold difference between the colonization of IFN-γ−/− mice and the previously reported colonization of BALB/c mice was calculated by dividing the average CI or CFU/g of tissue in IFN-γ−/− mice by the average CI or CFU/g of tissue in BALB/c mice and are listed at the bottom of each graph.
FIG. 2.
FIG. 2.
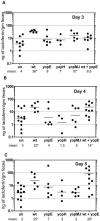
Infection with wild-type (wt) Y. pseudotuberculosis causes elevated intestinal inflammation as measured by fecal lactoferrin levels. Mice were orally inoculated with wild-type Y. pseudotuberculosis or yopE, yopH, or yopMJ mutant bacteria or a mixture of wild-type and yopE mutant bacteria. Fecal samples were collected daily and lactoferrin levels determined by ELISA. Each circle represents data from one mouse, and bars indicate the geometric means, which are also listed below the graph. Statistically significant differences (*) compared to uninfected (un) mice were determined by unpaired Student t test (P < 0.01).
FIG. 3.
FIG. 3.
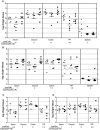
Levels of granulocytes in the PP and blood 5 days after infection with wild-type (wt) or yop mutant Y. pseudotuberculosis bacteria. Cells from the PP were stained with antibodies for GR-1 and CD11b and analyzed by FACS. Examples of histograms of granulocytes and monocytes/macrophages gated for Cd11b and GR-1 expression from wild-type samples are shown (A). PP (B) and blood (C) samples were collected at day 5 from uninfected mice (un) or mice orally inoculated with either wild-type or yopE, yopH, or yopMJ mutant bacteria or an equal mixture of wild-type and yopE mutant (wt+yopE) bacteria. The percentages of granulocytes of the total live cells are graphed; each circle represents data from one mouse, and bars indicate the geometric means. Statistically significant differences (*) compared to wild-type-infected samples were determined by unpaired Student t test (P < 0.01).
FIG. 4.
FIG. 4.
Infection of the spleen by the Y. pseudotuberculosis inv mutant strain inhibits intestinal colonization by yopE and yopH mutant, but not wild-type, Y. pseudotuberculosis. The log CFU/g of tissue of the inv strain (▪) recovered on day 5 from mice orally inoculated on day 0 with the yopE strain and injected i.p. on day 2 with the inv strain was calculated (A). Open symbols indicate that colonization by the inv mutant strain was below the limit of detection of 1 inv bacterium per 200 to 250 yopE bacteria. Colonization by the yopE (B) or yopH (C) mutant or wild-type (D) bacteria recovered on day 5 from mice orally inoculated on day 0 and injected i.p. on day 2 with PBS (▴) or the inv mutant strain (•) was determined. Each symbol represents data from one mouse, and bars indicate averages. The n-fold differences were calculated by dividing the average number of CFU/g of tissue of yopE or yopH mutant or wild-type bacteria in mice injected with PBS by the average number of CFU/g of tissue in mice injected with the inv mutant strain and are listed below each graph. Significant differences (*) between levels of colonization in mice treated with PBS versus mice treated with inv were determined by the unpaired Student t test (P < 0.05). The log CFU/g of tissue of yopE and yopH mutant bacteria in oral competition infections with wild-type Y. pseudotuberculosis is represented by the symbol × in panels B and C for comparison. These values were calculated from the previously reported competitive indices and in many cases are overestimates because the yop mutants were below the limit of detection (30).
FIG. 5.
FIG. 5.
Systemic infection of the spleen and liver with the inv mutant strain leads to elevated lactoferrin levels in fecal samples. Mice were orally inoculated on day 0 with the yopE mutant and subsequently injected on day 2 with either PBS (yopE/PBS) or the inv mutant strain (yopE/inv). Fecal samples from uninfected mice and infected mice were analyzed by ELISA for the concentration of the neutrophil protein lactoferrin. Each symbol represents data from one mouse, and bars indicate geometric means. The values below the graph are geometric mean numbers of nanograms of lactoferrin per gram of feces.
FIG. 6.
FIG. 6.
Infection of the spleen and liver by the inv mutant strain leads to elevated levels of granulocytes in the blood but not in PP. Cells from blood (A) and PP (B) samples collected from uninfected mice or mice orally inoculated with the yopE mutant and injected with either PBS (yopE/PBS) or the inv mutant strain (yopE/inv) at day 5 were stained with antibodies for GR-1 and CD11b and analyzed by FACS. Graphed are the percentages of granulocytes among the total live cells; each diamond represents the percentage from one mouse, and bars indicate the geometric means. Statistically significant differences (*) were determined by unpaired Student t test (P < 0.01).
FIG. 7.
FIG. 7.
Competition infections with yop mutant strains. Mice were orally inoculated with either yopE (A) or yopH (B) mutant bacteria singly or with an equal mixture of yopE and yopMJ (A) or yopH and yopMJ (B) mutant bacteria. On day 5, numbers of CFU/g of tissue were determined in single-strain infections of the yopE (▴) or yopH (▴) mutant and the yopE (•) or yopH (•) mutant in competition with the yopMJ (▪) mutant. Mice were orally inoculated with either yopE (C) or yopH (D) mutant bacteria or an equal mixture of yopE and yopH mutant bacteria (C and D). On day 5, the number of CFU/g of tissue was determined for the yopE (▴) mutant in a single-strain infection or for the yopE (•) mutant in competition with yopH mutant bacteria (C) and for yopH (⧫) mutant bacteria in a single-strain infection and yopH (▪) mutant bacteria in competition with the yopE mutant (D). The n-fold difference below each tissue equals the average number of CFU/g of yopE or yopH mutant bacteria singly versus in competition. Each symbol represents the colonization of one mouse, and bars indicate the geometric means. Statistically significant differences (*) were determined by unpaired Student t test (P < 0.05).

References

    1. Alonso, A., N. Bottini, S. Bruckner, S. Rahmouni, S. Williams, S. P. Schoenberger, and T. Mustelin. 2004. Lck dephosphorylation at Tyr-394 and inhibition of T cell antigen receptor signaling by Yersinia phosphatase YopH. J. Biol. Chem. 279:4922-4928. - PubMed
    1. Andersson, K., K. E. Magnusson, M. Majeed, O. Stendahl, and M. Fallman. 1999. Yersinia pseudotuberculosis-induced calcium signaling in neutrophils is blocked by the virulence effector YopH. Infect. Immun. 67:2567-2574. - PMC - PubMed
    1. Autenrieth, I. B., M. Beer, E. Bohn, S. H. Kaufmann, and J. Heesemann. 1994. Immune responses to Yersinia enterocolitica in susceptible BALB/c and resistant C57BL/6 mice: an essential role for gamma interferon. Infect. Immun. 62:2590-2599. - PMC - PubMed
    1. Bjune, G., T. E. Ruud, and J. Eng. 1984. Bacterial shock due to transfusion with Yersinia enterocolitica infected blood. Scand. J. Infect. Dis. 16:411-412. - PubMed
    1. Black, D. S., and J. B. Bliska. 2000. The RhoGAP activity of the Yersinia pseudotuberculosis cytotoxin YopE is required for antiphagocytic function and virulence. Mol. Microbiol. 37:515-527. - PubMed

Publication types

MeSH terms

Substances

LinkOut - more resources