The onset of CD8+-T-cell contraction is influenced by the peak of Listeria monocytogenes infection and antigen display
- PMID: 16495523
- PMCID: PMC1418632
- DOI: 10.1128/IAI.74.3.1528-1536.2006
The onset of CD8+-T-cell contraction is influenced by the peak of Listeria monocytogenes infection and antigen display
Abstract
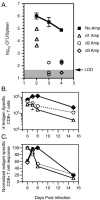
The CD8+-T-cell response to infection with Listeria monocytogenes consists of expansion, contraction, and memory phases. The transition between expansion and contraction is reported to occur on different days postinfection with virulent (8 to 9 days) and attenuated (DeltaactA) (7 days) L. monocytogenes strains. We hypothesized that differences in the infectious courses, and therefore antigen (Ag) display, determine the precise time of the expansion/contraction transition in response to these infections. To test this, we infected BALB/c mice with 0.1 50% lethal dose of DeltaactA or virulent L. monocytogenes and measured bacterial numbers, Ag display, and Ag-specific CD8+-T-cell responses on various days after infection. We found that bacterial numbers and Ag display peaked between 12 and 36 h and between 36 and 60 h after infection with DeltaactA and virulent L. monocytogenes strains, respectively. Infection with DeltaactA L. monocytogenes resulted in a sharp peak in the Ag-specific CD8+-T-cell response on day 7, while infection with virulent L. monocytogenes yielded a prolonged peak with equivalent numbers of Ag-specific CD8+ T cells on days 6, 7, and 8 after infection. Truncating virulent infection with antibiotics on day 1 or 2 after infection resulted in a shift in the expansion/contraction transition from day 8 to day 7 after infection. However, antibiotic treatment beginning on day 3, after the peak of virulent L. monocytogenes infection and Ag display, had no effect upon the magnitude or timing of the CD8+-T-cell response. These results demonstrate a direct relationship between the course of infection and Ag display and that the timing of these events is important in shaping the T-cell response to infection.
Figures


Similar articles
-
Duration of infection and antigen display have minimal influence on the kinetics of the CD4+ T cell response to Listeria monocytogenes infection.J Immunol. 2004 Nov 1;173(9):5679-87. doi: 10.4049/jimmunol.173.9.5679. J Immunol. 2004. PMID: 15494519
-
Programmed contraction of CD8(+) T cells after infection.Nat Immunol. 2002 Jul;3(7):619-26. doi: 10.1038/ni804. Epub 2002 Jun 3. Nat Immunol. 2002. PMID: 12055624
-
Intestinal and splenic T cell responses to enteric Listeria monocytogenes infection: distinct repertoires of responding CD8 T lymphocytes.J Immunol. 2001 Mar 15;166(6):4065-73. doi: 10.4049/jimmunol.166.6.4065. J Immunol. 2001. PMID: 11238655
-
Listeria monocytogenes: a model pathogen to study antigen-specific memory CD8 T cell responses.Semin Immunopathol. 2015 May;37(3):301-10. doi: 10.1007/s00281-015-0477-5. Epub 2015 Apr 10. Semin Immunopathol. 2015. PMID: 25860798 Free PMC article. Review.
-
Processing of Listeria monocytogenes antigens and the in vivo T-cell response to bacterial infection.Immunol Rev. 1999 Dec;172:163-9. doi: 10.1111/j.1600-065x.1999.tb01364.x. Immunol Rev. 1999. PMID: 10631945 Review.
Cited by
-
Infection with Francisella tularensis LVS clpB leads to an altered yet protective immune response.Infect Immun. 2013 Jun;81(6):2028-42. doi: 10.1128/IAI.00207-13. Epub 2013 Mar 25. Infect Immun. 2013. PMID: 23529616 Free PMC article.
-
RIPK3 and Caspase-1/11 Are Necessary for Optimal Antigen-Specific CD8 T Cell Response Elicited by Genetically Modified Listeria monocytogenes.Front Immunol. 2020 Apr 9;11:536. doi: 10.3389/fimmu.2020.00536. eCollection 2020. Front Immunol. 2020. PMID: 32328060 Free PMC article.
-
Listeria Monocytogenes: A Model Pathogen Continues to Refine Our Knowledge of the CD8 T Cell Response.Pathogens. 2018 Jun 16;7(2):55. doi: 10.3390/pathogens7020055. Pathogens. 2018. PMID: 29914156 Free PMC article. Review.
-
TRAF2 regulates T cell immunity by maintaining a Tpl2-ERK survival signaling axis in effector and memory CD8 T cells.Cell Mol Immunol. 2021 Sep;18(9):2262-2274. doi: 10.1038/s41423-020-00583-7. Epub 2020 Nov 17. Cell Mol Immunol. 2021. PMID: 33203937 Free PMC article.
-
Enumeration of cytotoxic CD8 T cells ex vivo during the response to Listeria monocytogenes infection.Infect Immun. 2008 Oct;76(10):4609-14. doi: 10.1128/IAI.00563-08. Epub 2008 Aug 4. Infect Immun. 2008. PMID: 18678661 Free PMC article.
References
-
- Ahmed, R., and D. Gray. 1996. Immunological memory and protective immunity: understanding their relation. Science 272:54-60. - PubMed
-
- Badovinac, V. P., K. A. Messingham, S. E. Hamilton, and J. T. Harty. 2003. Regulation of CD8+ T cells undergoing primary and secondary responses to infection in the same host. J. Immunol. 170:4933-4942. - PubMed
-
- Badovinac, V. P., B. B. Porter, and J. T. Harty. 2004. CD8+ T cell contraction is controlled by early inflammation. Nat. Immunol. 5:809-817. - PubMed
-
- Badovinac, V. P., B. B. Porter, and J. T. Harty. 2002. Programmed contraction of CD8+ T cells after infection. Nat. Immunol. 3:619-626. - PubMed
-
- Badovinac, V. P., A. R. Tvinnereim, and J. T. Harty. 2000. Regulation of antigen-specific CD8+ T cell homeostasis by perforin and interferon-gamma. Science 290:1354-1358. - PubMed
Publication types
MeSH terms
Substances
Grants and funding
- R01 AI050073/AI/NIAID NIH HHS/United States
- T32 AI007485/AI/NIAID NIH HHS/United States
- R01 AI059752/AI/NIAID NIH HHS/United States
- R01 AI042767/AI/NIAID NIH HHS/United States
- AI42767/AI/NIAID NIH HHS/United States
- AI059752/AI/NIAID NIH HHS/United States
- AI50073/AI/NIAID NIH HHS/United States
- R21 AI042767/AI/NIAID NIH HHS/United States
- AI46653/AI/NIAID NIH HHS/United States
- R01 AI046653/AI/NIAID NIH HHS/United States
- T32 GM007337/GM/NIGMS NIH HHS/United States
- R37 AI042767/AI/NIAID NIH HHS/United States
- T32AI07485/AI/NIAID NIH HHS/United States
LinkOut - more resources
Full Text Sources
Other Literature Sources
Medical
Research Materials

