

Antigen-responsive CD4+ T cells from C3H mice chronically infected with Leishmania amazonensis are impaired in the transition to an effector phenotype
- PMID: 16495525
- PMCID: PMC1418674
- DOI: 10.1128/IAI.74.3.1547-1554.2006
Antigen-responsive CD4+ T cells from C3H mice chronically infected with Leishmania amazonensis are impaired in the transition to an effector phenotype
Abstract
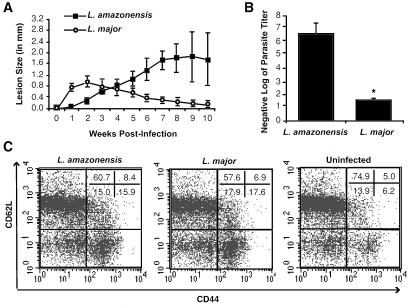
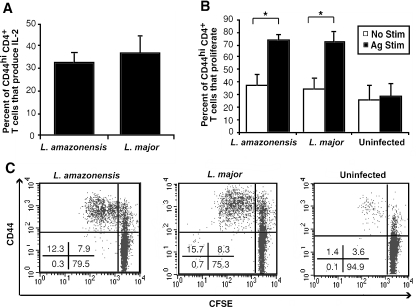
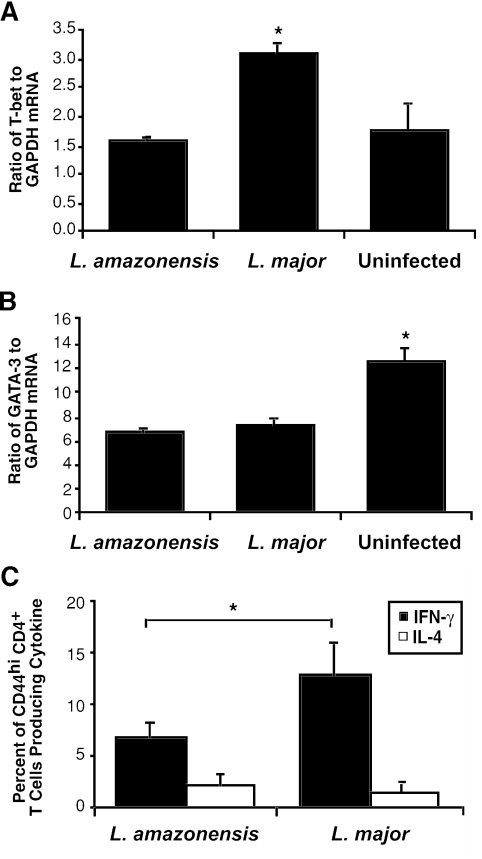
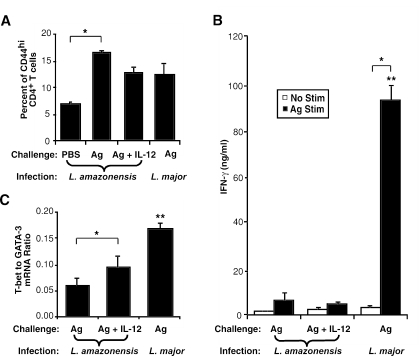
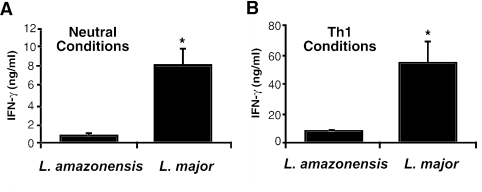
C3HeB/FeJ mice challenged with Leishmania major develop a polarized Th1 response and subsequently heal, whereas Leishmania amazonensis challenge leads to chronic lesions with high parasite loads at 10 weeks postinfection. In this study, a comparison of draining lymph node cells from L. amazonensis- and L. major-infected mice at 10 weeks postinfection showed equivalent percentages of effector/memory phenotype CD44hi CD4+ T cells producing interleukin-2 (IL-2) and proliferating after antigen stimulation. However, these cells isolated from L. amazonensis-infected mice were not skewed toward either a Th1 or Th2 phenotype in vivo, as evidenced by their unbiased Th1/Th2 transcription factor mRNA profile. In vivo antigen stimulation with added IL-12 failed to enhance gamma interferon (IFN-gamma) production of CD4+ T cells from L. amazonensis-infected mice. Antigen stimulation of CD4+ T cells from L. amazonensis-infected mice in vitro in the presence of IL-12 resulted in production of only 10 to 15% of the IFN-gamma produced by T cells from L. major-infected mice under identical conditions. These results suggest that the CD4+ T-cell response during chronic L. amazonensis infection is limited during the transition from an early activated CD4+ T-cell population to an effector cell population and demonstrate that these T cells have an intrinsic defect beyond the presence or absence of IL-12 during antigen stimulation.
Figures
Similar articles
-
CD4+ Th1 cells induced by dendritic cell-based immunotherapy in mice chronically infected with Leishmania amazonensis do not promote healing.Infect Immun. 2004 Aug;72(8):4455-63. doi: 10.1128/IAI.72.8.4455-4463.2004. Infect Immun. 2004. PMID: 15271903 Free PMC article.
-
Genetically resistant mice lacking interleukin-12 are susceptible to infection with Leishmania major and mount a polarized Th2 cell response.Eur J Immunol. 1996 Jul;26(7):1553-9. doi: 10.1002/eji.1830260722. Eur J Immunol. 1996. PMID: 8766560
-
Protection of C3HeB/FeJ mice against Leishmania amazonensis challenge after previous Leishmania major infection.Am J Trop Med Hyg. 2004 Oct;71(4):407-11. Am J Trop Med Hyg. 2004. PMID: 15516635
-
Distinct immunological states in murine cutaneous leishmaniasis by immunising with different amounts of antigen: the generation of beneficial, potentially harmful, harmful and potentially extremely harmful states.Behring Inst Mitt. 1997 Feb;(98):153-9. Behring Inst Mitt. 1997. PMID: 9382736 Review.
-
Cytokines in parasitic diseases: the example of cutaneous leishmaniasis.Int Rev Immunol. 1998;17(1-4):157-80. doi: 10.3109/08830189809084491. Int Rev Immunol. 1998. PMID: 9914947 Review.
Cited by
-
CD4+ T Cell-Dependent Macrophage Activation Modulates Sustained PS Exposure on Intracellular Amastigotes of Leishmania amazonensis.Front Cell Infect Microbiol. 2019 Apr 12;9:105. doi: 10.3389/fcimb.2019.00105. eCollection 2019. Front Cell Infect Microbiol. 2019. PMID: 31032234 Free PMC article.
-
Role of interleukin-1beta in activating the CD11c(high) CD45RB- dendritic cell subset and priming Leishmania amazonensis-specific CD4+ T cells in vitro and in vivo.Infect Immun. 2007 Oct;75(10):5018-26. doi: 10.1128/IAI.00499-07. Epub 2007 Aug 6. Infect Immun. 2007. PMID: 17682041 Free PMC article.
-
A systems approach to designing next generation vaccines: combining α-galactose modified antigens with nanoparticle platforms.Sci Rep. 2014 Jan 20;4:3775. doi: 10.1038/srep03775. Sci Rep. 2014. PMID: 24441019 Free PMC article.
-
Targeted extracellular signal-regulated kinase activation mediated by Leishmania amazonensis requires MP1 scaffold.Microbes Infect. 2014 Apr;16(4):328-36. doi: 10.1016/j.micinf.2013.12.006. Epub 2014 Jan 22. Microbes Infect. 2014. PMID: 24463270 Free PMC article.
-
Altered dendritic cell phenotype in response to Leishmania amazonensis amastigote infection is mediated by MAP kinase, ERK.Am J Pathol. 2009 May;174(5):1818-26. doi: 10.2353/ajpath.2009.080905. Epub 2009 Apr 6. Am J Pathol. 2009. PMID: 19349356 Free PMC article.
References
-
- Barral-Netto, M., A. Barral, C. E. Brownell, Y. A. Skeiky, L. R. Ellingsworth, D. R. Twardzik, and S. G. Reed. 1992. Transforming growth factor-beta in leishmanial infection: a parasite escape mechanism. Science 257:545-548. - PubMed
-
- Belkaid, Y., C. A. Piccirillo, S. Mendez, E. M. Shevach, and D. L. Sacks. 2002. CD4+CD25+ regulatory T cells control Leishmania major persistence and immunity. Nature 420:502-507. - PubMed
-
- Belkaid, Y., and B. T. Rouse. 2005. Natural regulatory T cells in infectious disease. Nat. Immunol. 6:353-360. - PubMed
-
- Chakir, H., H. Wang, D. E. Lefebvre, J. Webb, and F. W. Scott. 2003. T-bet/GATA-3 ratio as a measure of the Th1/Th2 cytokine profile in mixed cell populations: predominant role of GATA-3. J. Immunol. Methods 278:157-169. - PubMed
Publication types
MeSH terms
Substances
Grants and funding
LinkOut - more resources
Full Text Sources
Research Materials
