. 2006 Mar;74(3):1661-72.
doi: 10.1128/IAI.74.3.1661-1672.2006.

Gingipains of Porphyromonas gingivalis modulate leukocyte adhesion molecule expression induced in human endothelial cells by ligation of CD99

Affiliations

Gingipains of Porphyromonas gingivalis modulate leukocyte adhesion molecule expression induced in human endothelial cells by ligation of CD99

Peter L W Yun et al. Infect Immun. 2006 Mar.

Abstract

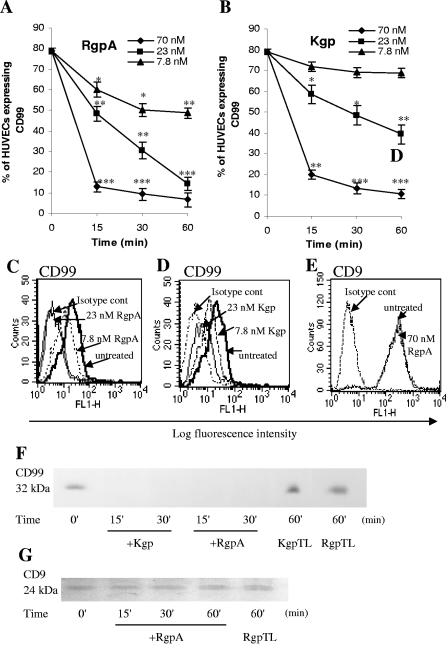
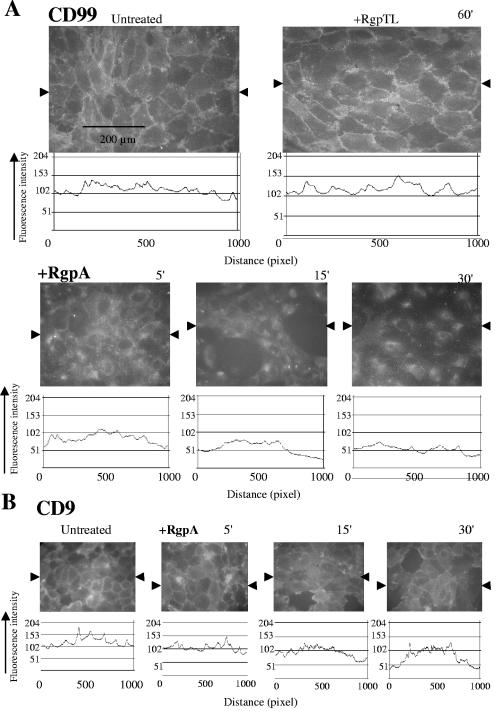
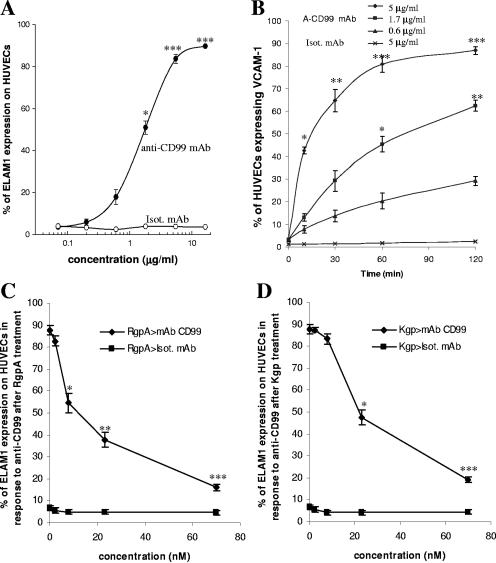
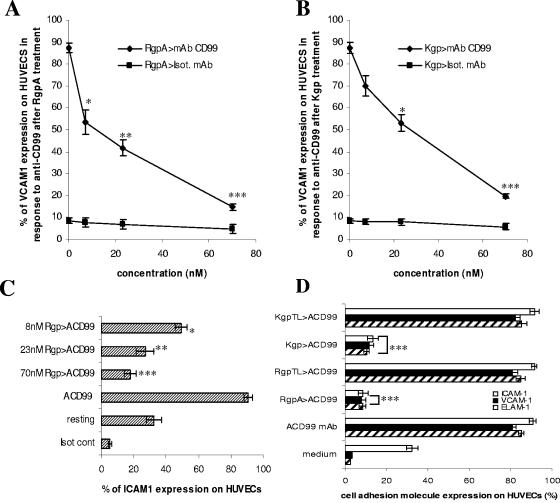
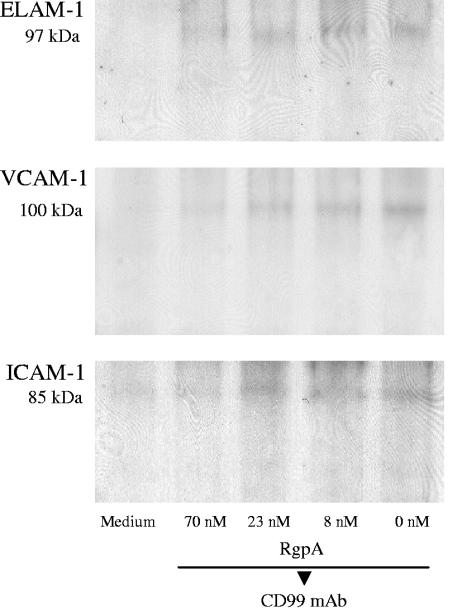
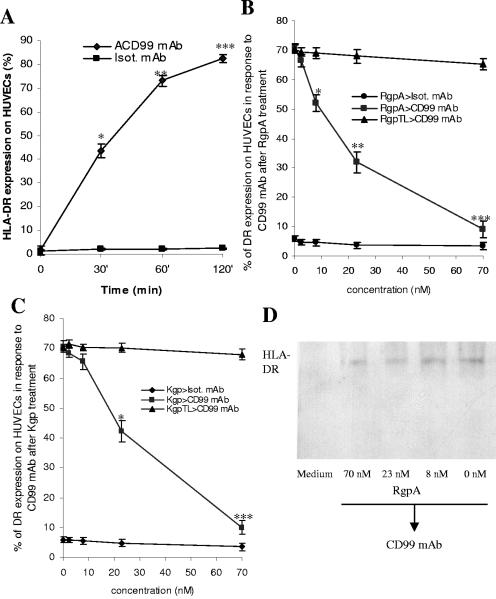
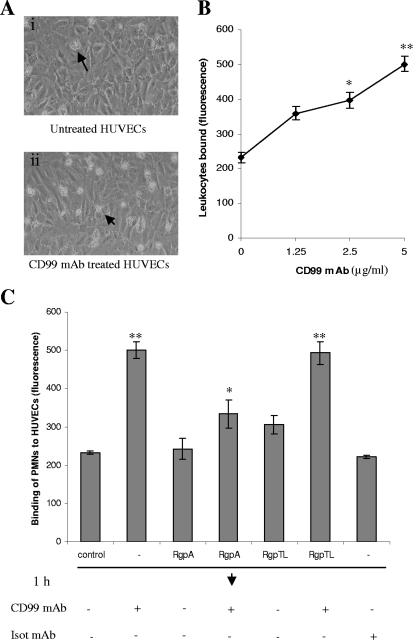
Porphyromonas gingivalis has been implicated as a key etiologic agent in the pathogenesis of destructive chronic periodontitis. Among virulence factors of this organism are cysteine proteinases, or gingipains, that have the capacity to modulate host inflammatory defenses. Intercellular adhesion molecule expression by vascular endothelium represents a crucial process for leukocyte transendothelial migration into inflamed tissue. Ligation of CD99 on endothelial cells was shown to induce expression of endothelial leukocyte adhesion molecule 1, vascular cell adhesion molecule 1, intercellular adhesion molecule 1, and major histocompatibility complex class II molecules and to increase adhesion of leukocytes. CD99 ligation was also found to induce nuclear translocation of NF-kappaB. These results indicate that endothelial cell activation by CD99 ligation may lead to the up-regulation of adhesion molecule expression via NF-kappaB activation. However, pretreatment of endothelial cells with gingipains caused a dose-dependent reduction of adhesion molecule expression and leukocyte adhesion induced by ligation of CD99 on endothelial cells. The data provide evidence that the gingipains can reduce the functional expression of CD99 on endothelial cells, leading indirectly to the disruption of adhesion molecule expression and of leukocyte recruitment to inflammatory foci.


Figures

FIG. 1.
FIG. 1.
Time course of down-regulation of CD99 expression on HUVECs on gingipain treatment. (A and B) Confluent HUVECs were incubated in the absence or presence of 5 mM cysteine-activated RgpA or Kgp for the indicated times and concentrations at 37°C. After treatment, HUVECs were collected by scraping and assayed for surface CD99 expression by flow cytometry. Error bars indicate the means ± SEM. *, P < 0.05; **, P < 0.01; and ***, P < 0.001, compared with untreated HUVECs. Results are representative of three separate experiments that yielded similar results. (C to E) Fluorescence histograms obtained by FACS of CD99 and CD9 expression on HUVECs after the addition of activated gingipains at indicated concentrations for 1 h. (F) Confluent HUVECs were treated with 70 nM activated gingipains, TLCK-inhibited Kgp (KgpTL), or TLCK-inhibited RgpA (RgpTL) for the indicated times. (G) Confluent HUVECs were incubated with 70 nM activated RgpA or TLCK-inhibited RgpA (RgpTL) for the indicated times. Endothelial cells were then lysed directly in reducing sample buffer with 20% (vol/vol) protease inhibitor cocktail. HUVEC lysates were resolved by 10% SDS-polyacrylamide gel electrophoresis and subjected to Western blot analysis with a primary antibody against CD99 or CD9.
FIG. 2.
FIG. 2.
CD99 distribution on HUVECs in the presence of RgpA. HUVECs were grown to confluence in an eight-well chamber culture slide and incubated with 23 nM RgpA for different times or with control medium alone. HUVECs were also treated with 2 mM TLCK-treated RgpA (RgpTL) for 60 min. Cells were fixed with 4% paraformaldehyde and subsequently stained with anti-CD99 MAb (A) or anti-CD9 MAb (B) followed by Alexa Fluor-conjugated secondary antibody. Cells were imaged using conventional fluorescence microscopy and digital photography. Images of HUVEC monolayers stained for surface antigen shown above were assessed for surface immunofluorescence using IQ Studio software as detailed in Materials and Methods. The fluorescence intensity of a region (10 × 1,000 pixels) was marked by arrowheads on each panel and then plotted as a histogram with the y axis representing the fluorescence intensity and the x axis representing distance (pixels). The peaks in fluorescence intensity for CD99 or CD9 represent the regions of intercellular junctions, and the ditches show the nonjunctional areas of staining. Each plot is representative of several separate measurements from two different experiments.
FIG. 3.
FIG. 3.
Influence of gingipains on CD99 MAb-induced expression of cell adhesion molecules on HUVECs. (A) Confluent HUVECs were stimulated with the indicated concentrations of anti-CD99 MAb alone or an isotype-matched (Isot.) MAb. ELAM-1 expression was analyzed by flow cytometry after a 2-h culture. (B) HUVECs were incubated with anti-CD99 (A-CD99) MAb or isotype-matched (Isot.) MAb at the indicated times and concentrations. After incubation, cells were treated with specific antibody for VCAM-1 and measured by flow cytometry. (C and D) HUVECs were pretreated in the presence of various concentrations of activated RgpA or Kgp for 1 h without serum. Cells were then washed gently with medium and stimulated with 5 μg/ml of anti-CD99 or isotype-matched (Isot.) MAb for 1 h. Surface expression of ELAM-1 was then evaluated as described in Materials and Methods. Error bars indicate the means ± SEM. The data shown are from three independent experiments that yielded similar results. *, P < 0.05; **, P < 0.01; and ***, P < 0.001, compared with corresponding controls.
FIG. 4.
FIG. 4.
Inhibitory dose responses of gingipains to VCAM-1 and ICAM-1 induction in CD99-stimulated HUVECs. (A and B) HUVECs were preincubated with different concentrations of activated RgpA (A) or Kgp (B) for 1 h. Cells were then washed and treated with 5 μg/ml of anti-CD99 MAb or isotype-matched (Isot.) MAb for 1 h. Surface expression of VCAM-1 was then evaluated by flow cytometry. (C) HUVECs were preincubated with indicated concentrations of activated RgpA and treated with anti-CD99 (ACD99) MAb. Cells were stained with anti-ICAM-1 MAb and measured by flow cytometry. (D) HUVECs were preincubated with 70 nM of activated gingipains or with TLCK-inhibited gingipains for 1 h. Cells were then washed and treated with 5 μg/ml of anti-CD99 (ACD99) MAb for 1 h. Surface expression of ICAM-1, VCAM-1, and ELAM-1 was then evaluated by flow cytometry. Data represent the means ± SEM from three independent experiments. *, P < 0.05; **, P < 0.01; and ***, P < 0.001, compared with the control group.
FIG. 5.
FIG. 5.
Western blot analysis of CD99 MAb-induced HUVEC adhesion molecule expression after RgpA treatment. HUVECs were preincubated with indicated concentrations of activated RgpA for 1 h, washed, and treated with 5 μg/ml of anti-CD99 MAb for 1 h. Cells were subjected to immunoblot analysis as described in Materials and Methods and stained with anti-ELAM-1, anti-VCAM-1, or anti-ICAM-1 polyclonal Abs. Representative results are shown from two independent experiments.
FIG. 6.
FIG. 6.
CD99 ligation increases HLA-DR expression in HUVECs. (A) HUVECs engaged with 5 μg/ml of anti-CD99 MAb or a control Ab for various times were tested for HLA-DR expression by flow cytometry. (B and C) HUVECs were pretreated with indicated concentrations of activated RgpA or Kgp for 1 h. Following incubation and washing, 5 μg/ml of anti-CD99 MAb or isotype-matched MAb was added to HUVECs and incubated for 1 h. The cells were stained with specific monoclonal antibody for HLA-DR and analyzed by flow cytometry. (D) Results are parallel to experiments for panel B. Immunoblot analysis was performed as described in Materials and Methods with a polyclonal antibody to HLA-DR. Data represent the means ± SEM from three independent experiments. *, P < 0.05; **, P < 0.01; and ***, P < 0.001, compared with the control group.
FIG. 7.
FIG. 7.
Effect of RgpA on anti-CD99 MAb enhanced leukocyte adhesion to HUVECs. (A) Phase-contrast photomicrographs (×200) of the binding of human PMNs (1 × 10⁶/well) to control and anti-CD99 MAb-treated HUVECs at the end of a 1-h monolayer adhesion assay. “Untreated” represents PMN-HUVECs without stimulation. PMNs bind to the surface of HUVECs as indicated by arrows. (B) Confluent HUVECs were stimulated with the indicated anti-CD99 MAb for 1 h. The calcein-AM labeled PMNs (1 × 10⁶/well) were then added to endothelial monolayers for 1 h. At the end of incubation, cells were washed three times with medium and the fluorescence of PMNs was measured by fluorimetry. (C) Confluent endothelial cell monolayers were treated either with activated RgpA (70 nM) or with TLCK-inhibited RgpA (RgpTL) for 1 h without serum. Monolayers were then washed gently in culture medium three times, and calcein-AM labeled PMNs (1 × 10⁶/well) together with anti-CD99 MAb at 5 μg/ml or isotype-matched antibody (Isot MAb) were added to the indicated wells for 1 h. At the end of incubation, the cells were washed three times with medium and the fluorescence of PMNs was measured by fluorimetry. The data correspond to mean values obtained from three independent experiments with similar treatments. Error bars indicate the means ± SEM. *, P < 0.05, and **, P < 0.01, compared with untreated HUVECs.
FIG. 8.
FIG. 8.
CD99 MAb induces NF-κB translocation in HUVECs. (A) HUVECs were stimulated with anti-CD99 MAb (ACD99 MAb) for different times or with control medium alone. HUVECs were also treated with 70 nM of activated gingipains or TLCK-inhibited RgpA (RgpTL) as indicated. Images were obtained using fluorescence microscopy. NF-κB localization was visualized by binding with an Alexa Fluor-conjugated secondary antibody. Cells displaying activated NF-κB are indicated by arrows. (B) Nuclear protein lysates of HUVECs were resolved by SDS-polyacrylamide gel electrophoresis and subjected to Western blot analysis with a monoclonal antibody to the p65 subunit of NF-κB. NF-κB p65 band density was increased in response to anti-CD99 MAb at 15 (lane 2) and 30 (lane 3) min compared with unstimulated HUVECs (lane 1). In contrast, NF-κB p65 band density was unchanged when HUVECs were treated with 70 nM Kgp (lane 4) or RgpA (lane 5) or TLCK-inhibited RgpA (RgpTL) (lane 6) for 30 min. This panel is representative of three separate experiments. The mean integrated optical band density determined by the TotalLab software (version 1.1; Greenwoods Corner, Auckland, New Zealand) is shown in panel C. Error bars indicate the means ± SEM. *, P < 0.05, and **, P < 0.01, compared with untreated HUVECs.

Similar articles

Cited by

References

    1. Allison, J. P., and L. L. Lanier. 1987. Structure, function and serology of the T-cell antigen receptor complex. Annu. Rev. Immunol. 5:503-540. - PubMed
    1. Amar, S., N. Gokce, S. Morgan, M. Loukideli, T. E. Van Dyke, and J. A. Vita. 2003. Periodontal disease is associated with brachial artery endothelial dysfunction and systemic inflammation. Arterioscler. Thromb. Vasc. Biol. 23:1245-1249. - PubMed
    1. Andrian, E., D. Grenier, and M. Rouabhia. 2004. In vitro models of tissue penetration and destruction by Porphyromonas gingivalis. Infect. Immun. 72:4689-4698. - PMC - PubMed
    1. Aubrit, F., C. Gelin, D. Pham, B. Raynal, and A. Bernard. 1989. The biochemical characterization of E2, a T cell surface molecule involved in rosettes. Eur. J. Immunol. 19:1431-1436. - PubMed
    1. Baker, P. J., L. Dufour, M. Dixon, and D. C. Roopenian. 2000. Adhesion molecule deficiencies increase Porphyromonas gingivalis-induced alveolar bone loss in mice. Infect. Immun. 68:3103-3107. - PMC - PubMed

Publication types

MeSH terms

LinkOut - more resources