. 2006 Feb 23;439(7079):936-42.
doi: 10.1038/nature04519.

Adaptive filtering enhances information transmission in visual cortex

Affiliations

Adaptive filtering enhances information transmission in visual cortex

Tatyana O Sharpee et al. Nature. .

Abstract

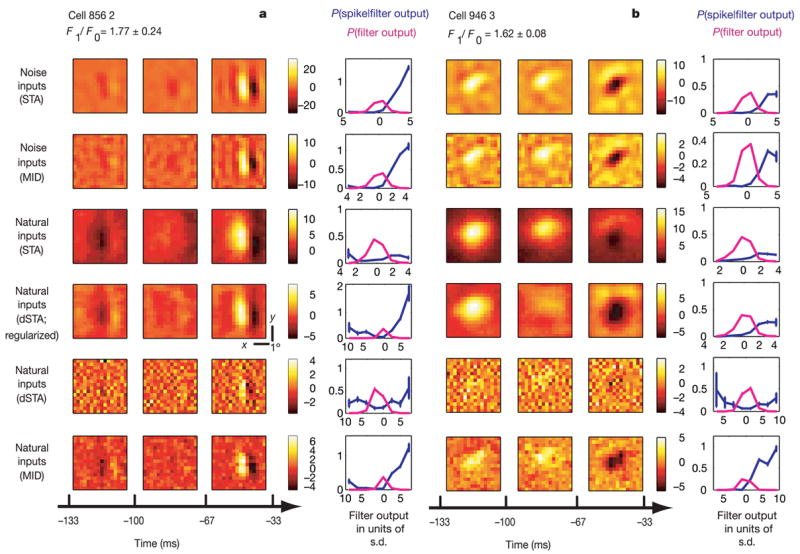
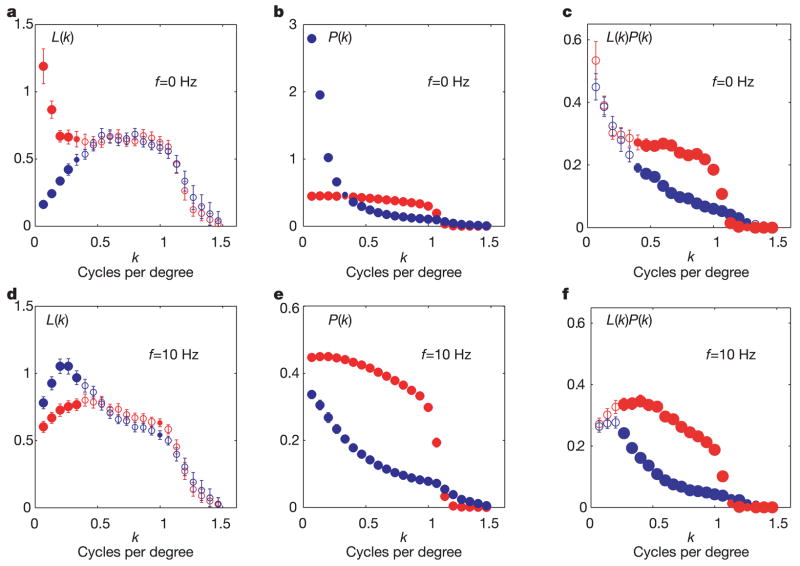
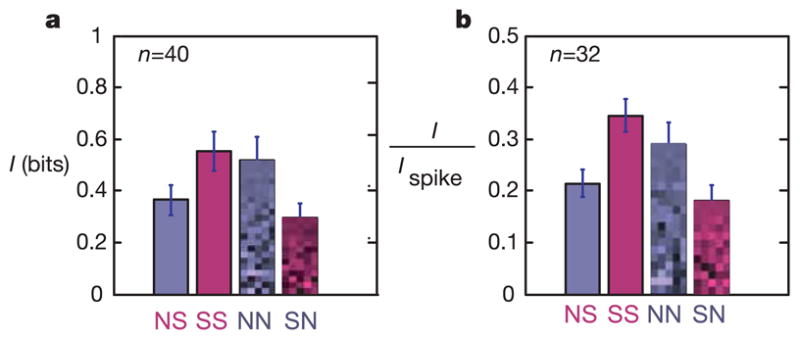
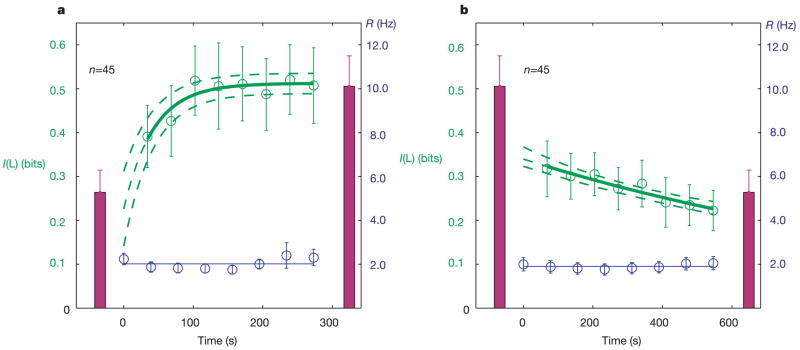
Sensory neuroscience seeks to understand how the brain encodes natural environments. However, neural coding has largely been studied using simplified stimuli. In order to assess whether the brain's coding strategy depends on the stimulus ensemble, we apply a new information-theoretic method that allows unbiased calculation of neural filters (receptive fields) from responses to natural scenes or other complex signals with strong multipoint correlations. In the cat primary visual cortex we compare responses to natural inputs with those to noise inputs matched for luminance and contrast. We find that neural filters adaptively change with the input ensemble so as to increase the information carried by the neural response about the filtered stimulus. Adaptation affects the spatial frequency composition of the filter, enhancing sensitivity to under-represented frequencies in agreement with optimal encoding arguments. Adaptation occurs over 40 s to many minutes, longer than most previously reported forms of adaptation.


Figures

Figure 1
Figure 1. Filters and nonlinearities for two simple cells
a, b, Top to bottom: STA and MID for noise ensemble; STA, dSTA, dSTA with regularization and MID for natural ensemble. Spatiotemporal receptive fields have three time frames covering the indicated time interval (− 133 to − 33 ms). In the right-most column for each filter we plot the probability distribution of filter outputs in the stimulus ensemble (magenta) and the spike probability given the filter output (blue; values on the y axis refer to these probabilities). The colour scale shows the filter in units of its average noise level (see Supplementary Methods). xy scale bars: 18. Error bars show standard errors of the mean in all figures.
Figure 2
Figure 2. Neural filters compensate for changes in the input power spectrum
Average amplitude spectra of neural filters (a, d) and input ensembles (b, e) corresponding to natural (blue circles) and white noise (red circles) stimulation for temporal frequencies of 0 and 10 Hz. The spectra were taken along the optimal orientation for each cell by interpolating the discrete two-dimensional Fourier transform. We use filled circles at frequencies where mean sensitivity was significantly different between the two ensembles (small circles for P < 0.05 and large circles for P < 0.01), and open circles otherwise. c, f, Plots of the product of the average neural filter and input ensemble amplitude spectra.
Figure 3
Figure 3. Receptive field adaptation increases information transmission
Bars show the mutual information between spikes and outputs of either the noise (blue, N) or natural scenes (red, S) filter applied to the natural scenes ensemble (solid) or noise ensemble (pixelated). NS, white noise filter applied to natural scenes ensemble; SS, natural scenes filter applied to natural scenes ensemble; NN, white noise filter applied to noise ensemble; SN, natural scenes filter applied to noise ensemble. The information values are given in bits (a) or in units of the total information carried by the arrival of a single spike Ispike (b).
Figure 4
Figure 4. Adaptation dynamics
a, b, The neural filter derived from the last half of natural stimulation is applied to the first half of natural (a) or to the noise (b) ensemble. Symbols show information (green, left y axis) and firing rate (blue, right y axis) averaged across cells, versus time. The solid line is an exponential fit; dashed lines show one standard deviation based on the jacobian of the fit (P = 0.01 in a and P = 0.003 in b using an F-test with null hypothesis of no time dependence). The taller (shorter) red bars show information for the natural filter applied to natural (noise) inputs (as in Fig. 3, but n = 45). The firing rates demonstrate that recordings are stable.

Comment in

  • Neurobiology: efficiency measures.
    DeWeese MR, Zador A. DeWeese MR, et al. Nature. 2006 Feb 23;439(7079):920-1. doi: 10.1038/439920a. Nature. 2006. PMID: 16495979 No abstract available.

References

    1. Theunissen FE, Sen K, Doupe AJ. Spectral-temporal receptive fields of nonlinear auditory neurons obtained using natural sounds. J Neurosci. 2000;20:2315–2331. - PMC - PubMed
    1. Sceniak MP, Hawken MJ, Shapley R. Contrast-dependent changes in spatial frequency tuning of macaque V1 neurons: effects of a changing receptive field size. J Neurophysiol. 2002;88:1363–1373. - PubMed
    1. Nolt MJ, Kumbhani RD, Palmer LA. Contrast-dependent spatial summation in the lateral geniculate nucleus and retina of the cat. J Neurophysiol. 2004;92:1708–1717. - PubMed
    1. Maffei L, Fiorentini A, Bisti S. Neural correlate of perceptual adaptation to gratings. Science. 1973;182:1036–1038. - PubMed
    1. Shapley R, Victor JD. The contrast gain control of the cat retina. Vision Res. 1979;19:431–434. - PubMed

Publication types