Comparative Study
. 2006 Jun 1;573(Pt 2):305-28.
doi: 10.1113/jphysiol.2005.103382. Epub 2006 Feb 23.

Kinetics of force recovery following length changes in active skinned single fibres from rabbit psoas muscle: analysis and modelling of the late recovery phase

Affiliations
Comparative Study

Kinetics of force recovery following length changes in active skinned single fibres from rabbit psoas muscle: analysis and modelling of the late recovery phase

Kevin Burton et al. J Physiol. .

Abstract

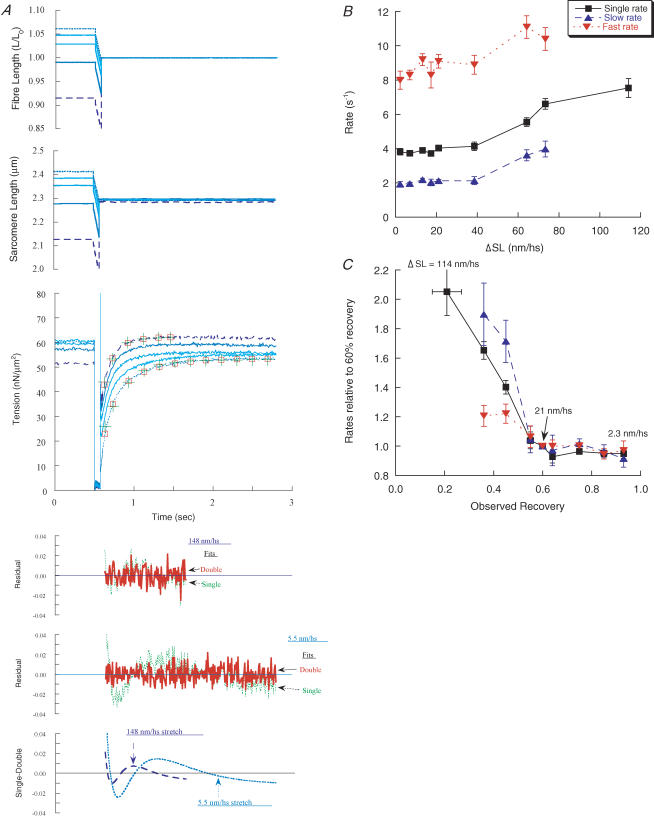
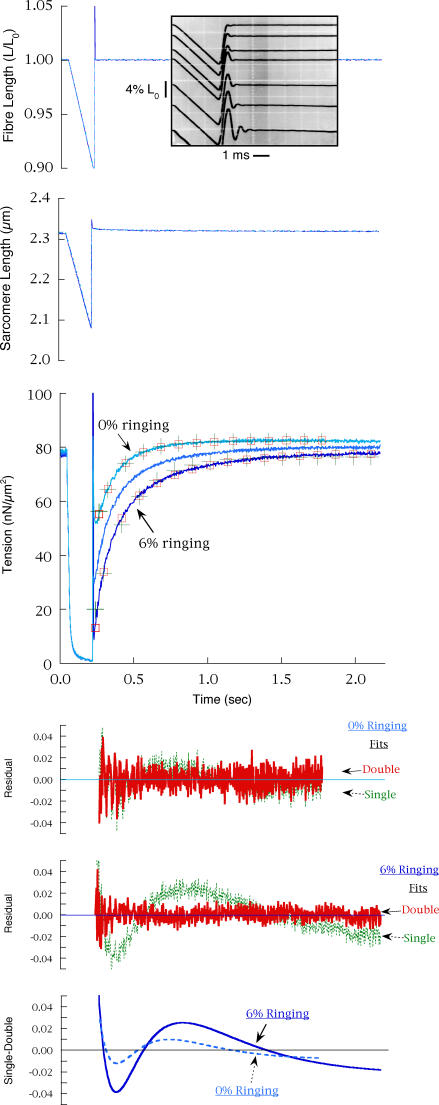
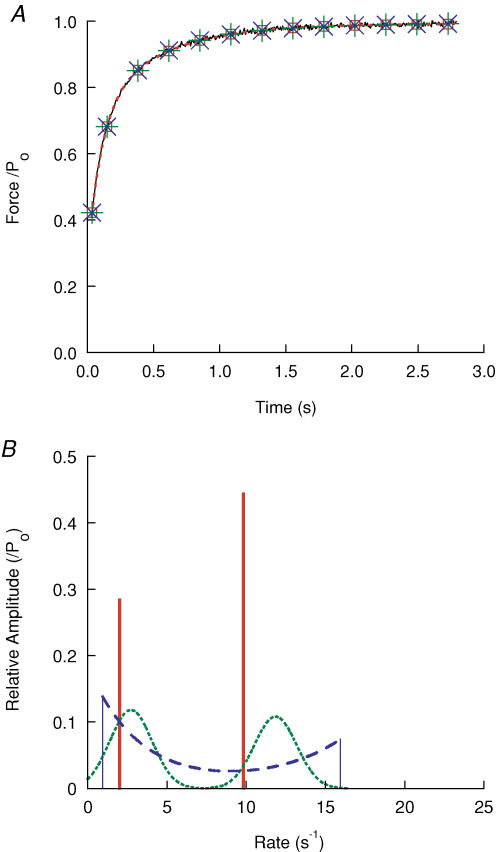
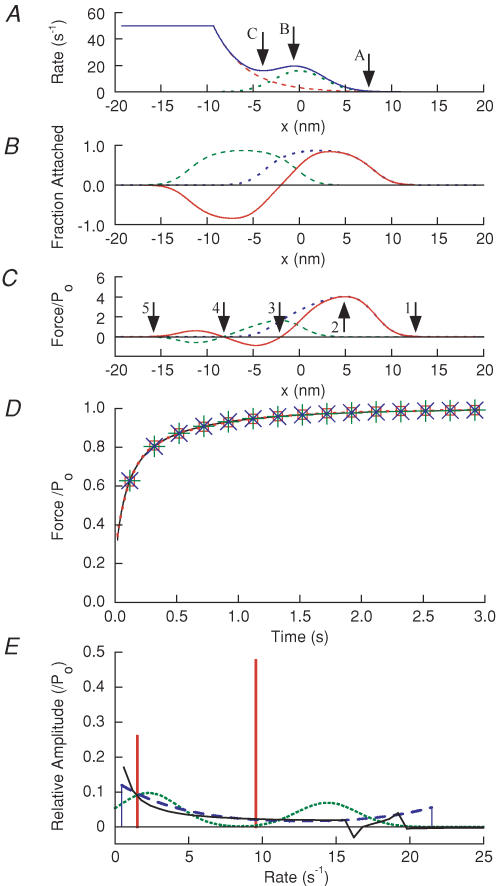
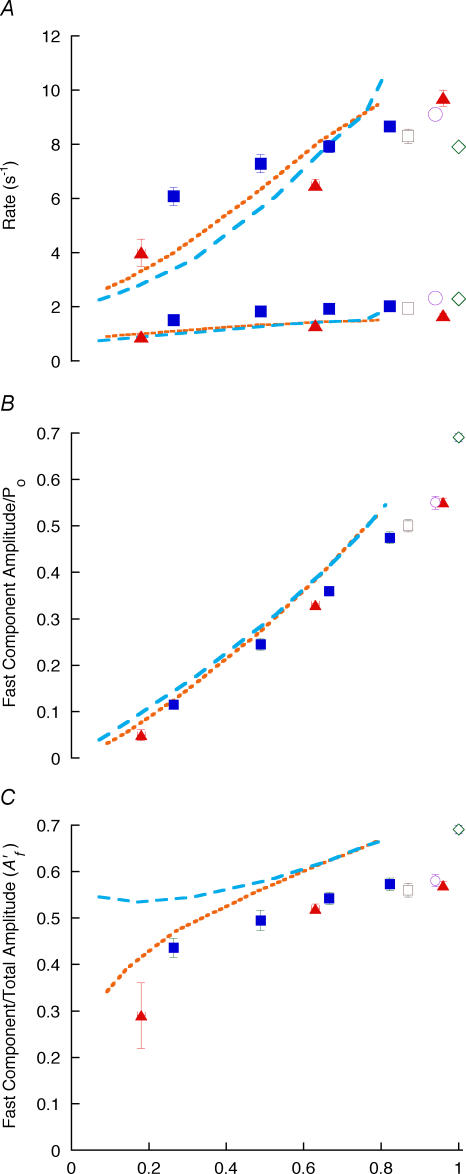
Redevelopment of isometric force following shortening of skeletal muscle is thought to result from a redistribution of cross-bridge states. We varied the initial force and cross-bridge distribution by applying various length-change protocols to active skinned single fibres from rabbit psoas muscle, and observed the effect on the slowest phase of recovery ('late recovery') that follows transient changes. In response to step releases that reduced force to near zero ( approximately 8 nm (half sarcomere)(-1)) or prolonged shortening at high velocity, late recovery was well described by two exponentials of approximately equal amplitude and rate constants of approximately 2 s(-1) and approximately 9 s(-1) at 5 degrees C. When a large restretch was applied at the end of rapid shortening, recovery was accelerated by (1) the introduction of a slow falling component that truncated the rise in force, and (2) a relative increase in the contribution of the fast exponential component. The rate of the slow fall was similar to that observed after a small isometric step stretch, with a rate of 0.4-0.8 s(-1), and its effects could be reversed by reducing force to near zero immediately after the stretch. Force at the start of late recovery was varied in a series of shortening steps or ramps in order to probe the effect of cross-bridge strain on force redevelopment. The rate constants of the two components fell by 40-50% as initial force was raised to 75-80% of steady isometric force. As initial force increased, the relative contribution of the fast component decreased, and this was associated with a length constant of about 2 nm. The results are consistent with a two-state strain-dependent cross-bridge model. In the model there is a continuous distribution of recovery rate constants, but two-exponential fits show that the fast component results from cross-bridges initially at moderate positive strain and the slow component from cross-bridges at high positive strain.


Figures

Figure 1
Figure 1. Diagram of laser diffractometer
The beam from a 5-mW HeNe laser was passed through a shaping lens and Fraunhofer lens (see Methods) via an adjustable mirror that controlled the angle of incidence onto the fibre. The fibre was held in a small drop of solution (40 μl) between a cooled glass pedestal and a glass coverslip by hooks attached to the servomotor and force transducer (not shown). The zeroth-order beam was blocked by a movable mask, while the first-order beam was passed to the photodiode. A shaping lens focused the first-order line down to a spot at the photodiode. Scattered light and lines of higher orders (on the same side as the measured first-order line) were blocked by masks at the photodiode. The fibre was positioned 31 cm from the photodiode and 12.2 cm from the mirror at the position illuminated by the laser (distances orthogonal to fibre axis). Drawing not to scale.
Figure 2
Figure 2. Phase 4 recovery elicited by isometric step length changes
Step releases and step stretches were applied to an activated fibre in sarcomere length (SL) control. A, records showing fibre length, SL and force for a step release and step stretch. Single- and double-exponential fits (+ and □, respectively) are shown overlaying phase 4 following the release (6 nm hs−1), and phases 3 and 4 following the stretch (1.8 nm hs−1). The single-exponential fit following the release is also indicated by a dashed line (through the + symbols). In the lowest panel, the upper two graphs show the residuals of the fits (dotted lines, single-exponential fits; continuous lines, double-exponential fits). The bottom graph shows differences between the single- and double-exponential fits normalized to recovery magnitude (dashed and continuous lines refer to stretch and release, respectively). The fitted parameters kr1, krs, krf and ks are, respectively, the rate constants of the single, slow rising, fast rising and slowest falling components, and Af is the amplitude of the fast component after a release relative to total recovery taken from the double-exponential fit. For the release, kr1 = 5.5 s−1, krs = 2.7 s−1, krf = 10.9 s−1 and Af = 0.58, and for the stretch, kr1 = 0.54 s−1, ks = 1.02 s−1, krf = 9.1 s−1 and the ratio of the amplitudes of the rising to falling components = −0.78. Fibre cross-section (CS) = 5.4 × 103μm2, fibre length = 2.3 mm. B, rate constants as a function of total recovery taken from double-exponential fits. Values are means ± s.e.m. The upper graph shows the absolute rate constants for single- (continuous line) and double- (dashed lines) exponential fits. Symbols: (▪,□) single, (▴,▵) slow, and (▾,▿) fast components; filled and open symbols refer to fibre (PM) and SL (SL) control, respectively. In the lower graph, rates at each magnitude of recovery were normalized to that obtained at a reference magnitude for each fibre; SL and PM data combined. The data from 43 fibres were grouped into categories of recovery magnitude with similar n values (∼50 and ∼15 in PM and SL control, respectively). C, as in panel B, but showing amplitudes of the exponential components (▿, Af/Po and ▵, As/Po) relative to isometric force (Po) plotted against AT/Po. The proportion of phase 4 in the fast component is shown (⊙Af = Af/(Af + As)). SL and PM data have been combined.
Figure 3
Figure 3. Ramp shortening to a stop
A, force records showing recovery following ramp shortening to a stop (shortening = 0.63 Lo, 66–97 nm hs−1, PM control) at three velocities: 0.57, 0.10 and 0.0048 Lo s−1 corresponding to ‘low’, ‘intermediate’ and ‘high’ loads, respectively. Single-exponential fits (+) are shown to recovery following the slowest and fastest ramps; a double-exponential (□) was also fitted to recovery following the fastest ramp, but was not obtained for the slowest ramp because recovery in that case was adequately fitted by a single-exponential (see B and C below). The fits to recovery from intermediate load are omitted for clarity. For the fast ramp, kr1 = 4.4 s−1, krs = 1.8 s−1, krf = 9.3 s−1 and Af = 0.58, and for the slow ramp, kr1 = 1.3 s−1. Initial force shown in the graph was higher than at the end of recovery (Po) due to the longer length before the ramp (2.42 μm versus 2.22–2.28 μm SL, respectively). CS = 4.2 × 103μm2, length = 2.1 mm. B, force records from A shifted so that recovery begins at the same time for all three loads. C, as in B, but with the force records shifted in time so their time courses coincide; a small vertical offset was applied to the force record at high force. D, comparison of force recovery for the three loads plotted with amplitudes normalized to 1.0 and offset to the same start time. Force data are shown as individual points, and fits are shown by continuous lines through the data points with symbols as in A. Recovery at high force was more single exponential in form, as judged by the goodness of fit of a single exponential and the small difference between single- and double-exponential fits.
Figure 4
Figure 4. Amplitudes of exponential components versus recovery magnitude
A, amplitudes for double-exponential fits to recovery after ramp shortening to a stop (▴), slack tests (⋄), step releases (▪), ramp + small stretch (□) and ramp−restretch + step release (○). A, Af; B and C, amplitudes of fast and slow components, respectively. Continuous lines represent a fitted exponential + line as described in the text. Values are means ± s.e.m.
Figure 5
Figure 5. Ramp shortening terminated by step stretches
A, a series of shortening ramps of constant size and velocity were terminated by step stretches of varying size (5.5, 19, 37, 79 and 148 nm hs−1) as shown in the graphs of fibre length and SL. All of the stretches ended at the same length; the length before the ramp was varied to achieve this and caused a variation in force before the ramp; Po = 56–58 nN μm−2 for the five records. Single- and double-exponential functions fitted to the force traces are shown for recovery resulting from the largest (dashed records) and smallest (dotted records) stretches. Fits and residuals are shown as in Fig. 2A. For the largest stretch (148 nm hs−1), kr1 = 7.6 s−1, krs = 4.8 s−1, krf = 10.8 s−1 and Af = 0.63; for the smallest stretch (5.5 nm hs−1), kr1 = 3.8 s−1, krs = 2.5 s−1, krf = 10.2 s−1 and Af = 0.55. CS = 6.2 × 103μm2, length = 2.17 mm. B, the dependence of the rate constants on the size of stretch and magnitude of recovery. Data show single (▪), slow (▴) and fast (▾) exponential rate constants. C, as in B, but the data are normalized within each fibre at a recovery magnitude of 60%Po plotted against observed recovery (force at recovery plateau minus Tmin, divided by Po); change in SL (ΔSL) is taken from the upper graph. It was usually not possible to obtain a double-exponential fit for the largest stretches eliciting the smallest recovery. For the single-exponential fits, n = 5–20 records, and for the double exponentials, n = 5–16 records for each data point; 13 fibres were studied.
Figure 6
Figure 6. Underdamped restretch or restretch + step release
Shortening ramps were terminated by step stretches that were underdamped to various extents, causing ‘ringing’ of the servomotor. Force records with ringing amplitude of 0%, 2.8% and 6.2%Lo are shown, with the lowest Tmin resulting from the largest ringing. The full amplitude of ringing was not sampled in the computer data, but the actual time courses were recorded separately on an oscilloscope (inset to fibre length graph). Records were in PM control, as underdamping tended to destabilize the feedback loop during the large restretches. Single- and double-exponential functions are shown for the records corresponding to 0% and 6.2% ringing. For the critically damped restretch, where the double-exponential fit is only slightly better than the single exponential (see residuals and double–single difference traces), kr1 = 6.3 s−1, krs = 4.0 s−1, krf = 11.2 s−1 and Af = 0.62, and for the underdamped restretch, kr1 = 4.5 s−1, krs = 2.4 s−1, krf = 10.8 s−1 and Af = 0.56. CS = 4.6 × 103μm2, length = 2.45 mm.
Figure 7
Figure 7. Force recovery versus temperature
A, records showing force recovery elicited by ramp–restretch protocol at temperatures from 8°C-1° (l-r) in SL control. Fibre cross-section = 5.2 × 103μm2, length = 2.75 mm, SL = 2.33 μm. The record at 1°C was acquired for 6 s (only 3 s shown). The full magnitude of the force spike during the restretch was not sampled. B, dependence of isometric force and Tmin on temperature over the temperature range 0–10°C. Three fibres were studied, with n = 4 (sets of two to three repeats at each temperature) at 2–8°C, n = 2 at 10°C, and n = 1 at 0°C. One fibre was studied in both SL and PM control. Isometric force was defined either as the steady force before the ramp (×) or the offset of a two-exponential fit (□ and continuous line); both were divided by their respective values at 5°C within each fibre and then averaged among fibres. The two measures of force varied in the same way with temperature. The variation in Tmin with temperature (○ and dashed line) is shown normalized in the same way, but also multiplied by the mean Tmin divided by the offset at 5°C to emphasize its relationship to isometric force and to show its smaller temperature dependence. The restretch was adjusted for critical damping. Many error bars (s.e.m.) are smaller than the symbols.
Figure 8
Figure 8. Temperature dependence of related force transients
The rate constant of the fast component of force recovery elicited by ramp–restretch (□) is compared to force transients elicited by other perturbations over a range of temperatures, including pressure release (‘phase 2’ of Fortune et al. 1994; ▴), caged phosphate (kpi of Dantzig et al. 1992 (⋄) and Walker et al. (1992) (▵)), sinusoidal analysis (‘process b’ of Zhao & Kawai, 1994; ○), temperature jump (‘phase 2’ of Bershitsky & Tsaturyan, 1992 (▪) and τneg−1 of Davis & Rodgers (1995) (▾) and step stretch (‘phase 2b’ of Ranatunga et al. 2002; •). Rate constants shown at more than one temperature are connected by straight lines. Some values have been estimated from Q10 values taken from the data, and these are marked (+). The rate constant of phase 2 of the pressure release response is shown at 12°C (28 s−1, Fortune et al. 1994); the temperature dependence was reported separately (Fortune, 1990), with the Q10 values of their phases 2 and 3 being ∼4.5–5 and ∼2, respectively. The values shown in the graph refer to experiments at low phosphate concentration (∼1 mm). The published temperature-jump data of Davis & Rodgers (1995; τneg−1) were obtained at 15 mm phosphate, and are similar to the rate of force recovery elicited by ramp–restretch at that phosphate concentration (Burton et al. 2005), which is ∼1.9-fold higher than reported here. On the assumption that the two types of force response share the same phosphate dependence, their data have been reduced by the same factor to give the data points shown in the graph. The rate of force recovery following ramp–restretch at 20°C was obtained from fibres rapidly activated by release of ATP from a caged precursor (Sleep et al. 2005).
Figure 9
Figure 9. Experimental recovery record fitted with exponential distributions
A, force recovery following a shortening step of 8.9 nm hs−1 overlaid by two exponentials (□ and dashed line), two Gaussian distributions (+), and bounded distribution of exponentials (×). B, graph of amplitude of component versus rate constant for two Guassian distributions (dotted line), a bounded distribution of exponentials (dashed line and a simple fit of two exponentials (vertical lines).
Figure 10
Figure 10. Results of fitting a cross-bridge model recovery record
The record was a shortening step of 8.25 nm hs−1. A, plot of f (dotted line), g (dashed line) and r ( = f + g; continuous line) versus x. B, distribution of attached cross-bridges P(x) with respect to x, in the isometric state (dotted line), immediately after the step (dashed line) and difference ΔPa between these distributions (continuous line). C, distribution of force F(x) in the isometric state (dotted line), immediately after the step (dashed line) and difference, A(x), between these distributions (continuous line). D force recovery time course calculated from model; symbols as in Fig. 9A. E, amplitude B(r) of exponential components for: model (continuous line), two exponentials (vertical bars), two Gaussian distributions (dotted line) and bounded distribution of exponentials (dashed line). The isometric tension (Po) and stiffness averaged over all cross-bridges were 1.46 pN and 0.14 pN nm−1, respectively. It should be noted that x is the distance between a cross-bridge and the actin site, and is the strain upon attachment; in the model there is an obligatory force-producing step h so the net strain is x + h.
Figure 11
Figure 11. Dependence on amplitude of recovery of amplitude and rate of exponentials fitted to model data
Model recovery records from shortening steps and ramps of varying amplitude were fitted with two exponentials. A, plot of fast and slow component rate constants versus amplitude of recovery from steps (dashed line) and ramps (dotted line). B, plot of fast component amplitude versus amplitude of recovery for steps (dashed line) and ramps (dotted line). C, plot of fractional amplitude of fast component versus amplitude of recovery for steps (dashed line) and ramps (dotted line). Corresponding points from experimental data are included for comparison (from Fig. 4).

Similar articles

Cited by

References

    1. Bagni MA, Cecchi G, Colomo F, Tesi C. The mechanical characteristics of the contractile machinery at different levels of activation in intact single muscle fibres of the frog. In: Sugi H, Pollack GH, editors. Molecular Mechanisms of Muscle Contraction. New York: Plenum Publishing; 1988. pp. 473–488. - PubMed
    1. Bershitsky SY, Tsaturyan AK. Tension responses to joule temperature jump in skinned rabbit muscle fibres. J Physiol. 1992;447:425–448. - PMC - PubMed
    1. Bershitsky SY, Tsaturyan AK. The elementary force generation process probed by temperature and length perturbations in muscle fibres from the rabbit. J Physiol. 2002;540:971–988. - PMC - PubMed
    1. Brenner B. Technique for stabilizing the striation pattern in maximally calcium-activated skinned rabbit psoas fibers. Biophys J. 1983;41:99–102. - PMC - PubMed
    1. Brenner B. Sarcomeric domain organization within single skinned rabbit psoas fibers and its effects on laser light diffraction patterns. Biophys J. 1985;48:967–982. - PMC - PubMed

Publication types