Comparative Study
. 2006 Jun 15;107(12):4628-35.
doi: 10.1182/blood-2005-11-4370. Epub 2006 Feb 23.

The incidence of leukemia and mortality from sepsis in patients with severe congenital neutropenia receiving long-term G-CSF therapy

Affiliations
Comparative Study

The incidence of leukemia and mortality from sepsis in patients with severe congenital neutropenia receiving long-term G-CSF therapy

Philip S Rosenberg et al. Blood. .

Abstract

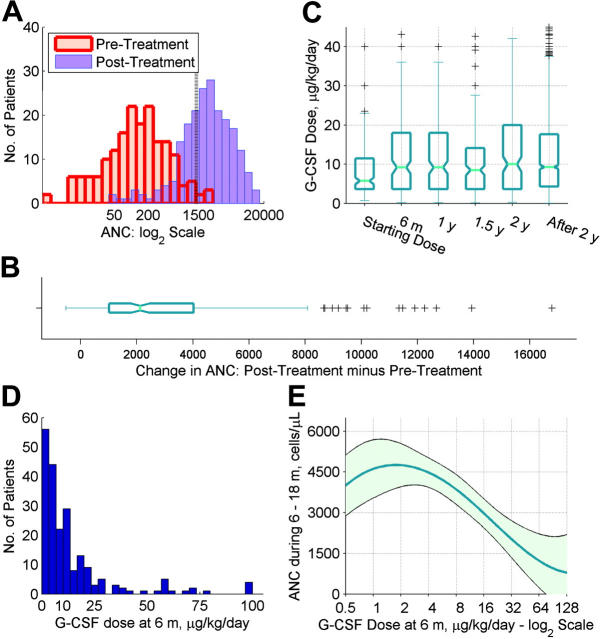
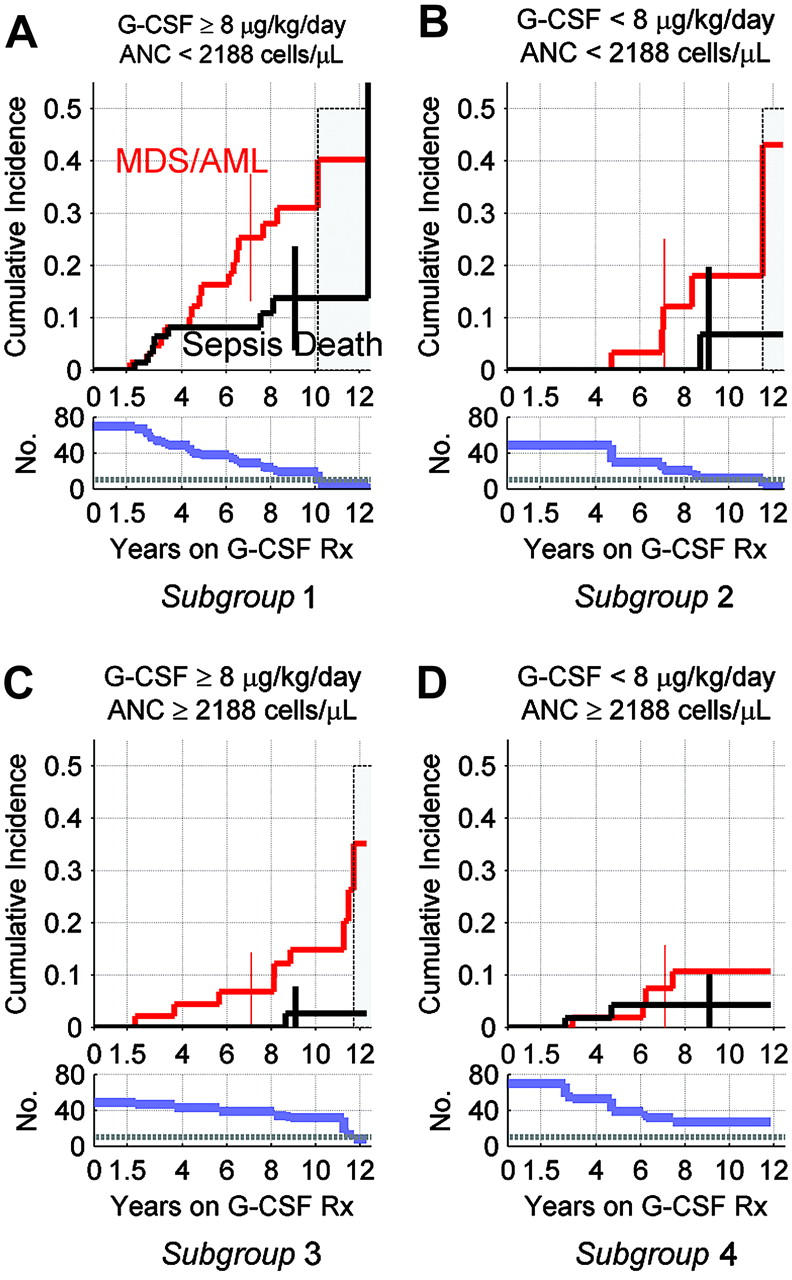
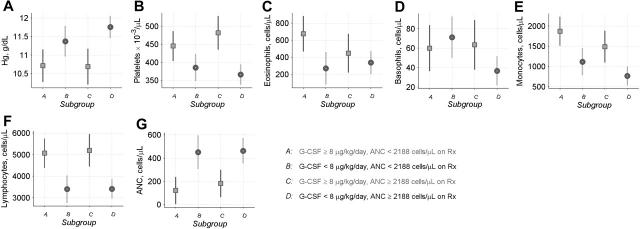
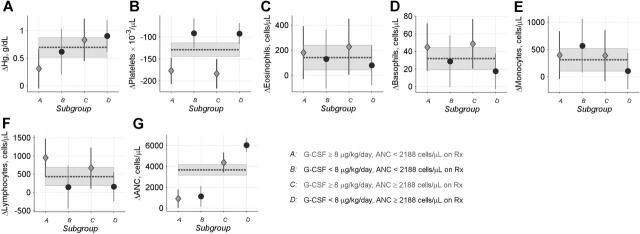
In patients with severe congenital neutropenia (SCN), sepsis mortality is reduced by treatment with granulocyte colony-stimulating factor (G-CSF), but myelodsyplastic syndrome and acute myeloid leukemia (MDS/AML) have been reported. We studied 374 patients with SCN and 29 patients with Shwachman-Diamond syndrome (SDS) on long-term G-CSF enrolled in the Severe Chronic Neutropenia International Registry. In SCN, sepsis mortality was stable at 0.9% per year. The hazard of MDS/AML increased significantly over time, from 2.9% per year after 6 years to 8.0% per year after 12 years on G-CSF. After 10 years, the cumulative incidence was 8% for sepsis mortality and 21% for MDS/AML. A subgroup of SCN patients (29%) received more than the median dose of G-CSF (> or = 8 microg/kg/d), but achieved less than the median absolute neutrophil count (ANC) response (ANC < 2.188 x 10(9)/L [2188/microL] at 6-18 months). In these less-responsive patients, the cumulative incidence of adverse events was highest: after 10 years, 40% developed MDS/AML and 14% died of sepsis, compared with 11% and 4%, respectively, of more responsive patients whose ANC was above the median on doses of G-CSF below the median. Risk of MDS/AML may be similar in SDS and SCN. In less-responsive SCN patients, early hematopoietic stem cell transplantation may be a rational option.


Figures

Figure 1.
Figure 1.
Cumulative incidence and hazard rates of MDS/AML and death from sepsis in patients with SCN. Results are shown for patients in SCN Group 1 (Table 1). One additional death from sepsis at year 12.4 is not shown on the plot. (A) Cumulative incidence (cumulative proportion experiencing each event as initial cause of failure in subjects at risk of each adverse event), by years on therapy with G-CSF, and 95% CIs at selected years (error bars). Observed cumulative incidence (stair-step curves), and smoothed cumulative incidence (dashed curves) derived from estimated cause-specific hazard functions are shown. (B) Annual hazard rates (incidence rate per year among subjects who are still susceptible) of MDS/AML and death from sepsis, by years on G-CSF therapy, and 95% point-wise confidence envelopes (shaded regions).
Figure 2.
Figure 2.
Pretreatment ANC, on-treatment ANC, and dose of G-CSF in patients with SCN. Panels A-D show data for SCN Group 6, while panel E shows data for SCN Group 5 (Table 1). (A) Histograms of mean ANC values prior to treatment (red bars), and mean ANC values during the 6-18 month follow-up period (blue bars), shown on a log2 scale. A vertical reference line is shown at 1500 cells/μL, corresponding to the therapeutic target. (B) Box plot of mean ANC values during the 6-18 month follow-up minus pretreatment mean ANC values, displaying the median value, inter-quartile range, 10th and 90th percentiles, and outliers (plus signs). Notches show 95% confidence intervals for the median. (C) Box plots of G-CSF dose values (μg/kg/d), by follow-up period. Box plots are constructed as described for panel B. Two hundred eleven patients contributed 2,440 G-CSF dose values over time; all values for each patient are shown. Starting dose corresponds to 0-3 days of follow-up; 6 m, to between 3 days and 8 months; 1 y, to between 9 and 14 months; 1.5 y, to between 15 and 20 months; 2 y, to between 21 and 26 months; and after 2 y, to between 27 months and 12.44 years. (D) Histogram of G-CSF dose (μg/kg/d) for each patient at or closest to 6 months. The right-most bar represents 4 patients with dose values of 120, 128, 189, and 576 μg/kg/d. (E) Dose of G-CSF at 6 months, and average ANC response over the subsequent year. Dose of G-CSF is plotted on the log2 scale. Curve plots the mean value. Shaded area corresponds to 95% point-wise confidence limits. The nonparametric regression incorporated precision weights equal to the number of CBC values available for each patient during the 6- to 18-month follow-up period.
Figure 3.
Figure 3.
Cumulative incidence of MDS/AML and death from sepsis, by G-CSF dose at 6 months, and average ANC response over the subsequent year, in patients with SCN. Results are shown for patients in SCN Group 5 (Table 1). Top panels show cumulative incidence of MDS/AML and death from sepsis by years on G-CSF therapy; see legend to Figure 1 for details. Bottom panels show corresponding numbers of subjects still at risk and under follow-up, with horizontal reference lines at n = 10 patients. With 10 or fewer subjects, the estimated cumulative incidence curves become unstable, as indicated by gray shaded areas in top panels. Error bars in top panels show 95% confidence limits at years 7 (MDS/AML) and 9 (deaths from sepsis). (A) Cumulative incidence in subjects with mean ANC less than 2.188 × 10⁹/L (2188/μL) cells during the 6- to 18-month follow-up period on G-CSF at 6 month at 8 μg/kg/d or more. (B) Cumulative incidence in subjects with ANC less than 2.188 × 10⁹/L (2188/μL) cells on G-CSF of less than 8 μg/kg/d. (C) Cumulative incidence in subjects with ANC of 2.188 × 10⁹/L (2188/μL) cells or more on G-CSF of 8 μg/kg/d or more. (D) Cumulative incidence in subjects with ANC of 2.188 × 10⁹/L (2188/μL) cells or more on G-CSF of less than 8 μg/kg/d.
Figure 4.
Figure 4.
Pretreatment CBC counts in patients with SCN. Data are shown for patients in SCN Group 6 (Table 1). Symbols show mean CBC values for the period from 3 years before the start of treatment through the day that treatment was started (▪ or •) and 95% confidence limits (error bars), for patients in subgroups A to D defined by G-CSF dose at 6 months and ANC response during the subsequent year (for further information about subgroups A to D, see Figure 3 and Table 2). These analyses incorporated precision weights determined by the number of patient-specific CBC values available prior to treatment. Panels show (A) hemoglobin, (B) platelets, (C) eosinophils, (D) basophils, (E) monocytes, (F) lymphocytes, and (G) pretreatment ANC.
Figure 5.
Figure 5.
Changes in CBC counts in SCN patients. Data are shown for patients in SCN Group 6 (Table 1). Glyphs show patient-specific changes in mean CBC values during the 6- to 18-month follow-up versus pretreatment mean CBC values (♦ or •), and 95% confidence limits (error bars), for patients in subgroups A to D (see legend to Figure 3 for details). Dotted lines and gray shaded bands show mean values and corresponding 95% confidence limits for changes in all patients combined. These analyses incorporated precision weights equal to nm/(n + m), where m is the number of pretreatment CBC and n is the number of posttreatment CBC. Panels show changes in (A) hemoglobin, (B) platelets, (C) eosinophils, (D) basophils, (E) monocytes, (F) lymphocytes, and (G) ANC.

References

    1. Zeidler C, Welte K. Kostmann syndrome and severe congenital neutropenia. Semin Hematol. 2002;39: 82-88. - PubMed
    1. Alter BP. Inherited bone marrow failure syndromes. In: Nathan DG, Orkin SH, Look AT, Ginsburg D, eds. Hematology of Infancy and Childhood. Philadelphia: WB Saunders Inc; 2003: 280-365.
    1. Miller RW. Childhood cancer and congenital defects: a study of U.S. death certificates during the period 1960-1966. Pediatr Res. 1969;3: 389-397. - PubMed
    1. Gilman PA, Jackson DP, Guild HG. Congenital agranulocytosis: prolonged survival and terminal acute leukemia. Blood. 1970;36: 576-585. - PubMed
    1. Rosen RB, Kang SJ. Congenital agranulocytosis terminating in acute myelomonocytic leukemia. J Pediatr. 1979;94: 406-408. - PubMed

Publication types

MeSH terms

Substances