Comparative Study
. 2006 Mar 22;25(6):1253-62.
doi: 10.1038/sj.emboj.7601021. Epub 2006 Feb 23.

In vivo role of the HNF4alpha AF-1 activation domain revealed by exon swapping

Affiliations
Comparative Study

In vivo role of the HNF4alpha AF-1 activation domain revealed by exon swapping

Nadège Briançon et al. EMBO J. .

Abstract

The gene encoding the nuclear receptor hepatocyte nuclear factor 4alpha (HNF4alpha) generates isoforms HNF4alpha1 and HNF4alpha7 from usage of alternative promoters. In particular, HNF4alpha7 is expressed in the pancreas whereas HNF4alpha1 is found in liver, and mutations affecting HNF4alpha function cause impaired insulin secretion and/or hepatic defects in humans and in tissue-specific 'knockout' mice. HNF4alpha1 and alpha7 isoforms differ exclusively by amino acids encoded by the first exon which, in HNF4alpha1 but not in HNF4alpha7, includes the activating function (AF)-1 transactivation domain. To investigate the roles of HNF4alpha1 and HNF4alpha7 in vivo, we generated mice expressing only one isoform under control of both promoters, via reciprocal swapping of the isoform-specific first exons. Unlike Hnf4alpha gene disruption which causes embryonic lethality, these 'alpha7-only' and 'alpha1-only' mice are viable, indicating functional redundancy of the isoforms. However, the former show dyslipidemia and preliminary results indicate impaired glucose tolerance for the latter, revealing functional specificities of the isoforms. These 'knock-in' mice provide the first test in vivo of the HNF4alpha AF-1 function and have permitted identification of AF-1-dependent target genes.


Figures
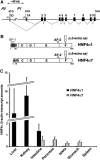
Figure 1
Figure 1
Structure of the mouse Hnf4α gene, its isoforms and expression of transcripts. Scheme of the Hnf4α gene (A) and isoforms (B). HNF4α1 and HNF4α7 are transcribed from P1 and P2 promoters, respectively, and differ only by the amino acids encoded by their first exon (A and D, respectively). Exon 1A carries the AF-1 motif. In (A), exon-coding sequences are shown as boxes. Arrows, transcription start sites. Other isoforms (α2 and α8; see Figure 2) present a 10-amino-acid insertion in the F domain due to usage of an alternative splice donor site 3′ to exon 9 (white box). (C) Quantitative real-time PCR assays performed on cDNA from 11–16-week-old mouse tissues (n⩾3). In the intestine (duodenum and part of the small intestine), the ratio of HNF4α1 mRNA to that of HNF4α7 is about × 2.4. The spleen was used as a negative control for HNF4α expression.
Figure 2
Figure 2
Hnf4α1/α7 reciprocal knock-in replacement. (A, B) Scheme of the plasmid constructs and the genomic loci before and after homologous recombination in ES cells. In (A), replacement of the HNF4α7 exon 1D CDS by the HNF4α1 exon 1A CDS, and the reciprocal in (B). Neo, G418-resistance cassette; DT-A, diphtheria toxin A (see Supplementary Figure S1). (C) Semiquantitative radioactive RT–PCR was performed with liver total RNA using specific forward primers (left) designed in the HNF4α1 or HNF4α7 exon1 CDS or in the 5′UTR at the P1 promoter. A reverse primer common to both isoforms was used. The HNF4α7 first exon is 39 bp shorter than that of HNF4α1, giving rise to a smaller band in the α7-only and heterozygous (α7/+) mouse livers while using the P1-5′UTR primer. Enhanced expression from the P2 promoter in α7-only mice has already been described and interpreted (Briancon et al, 2004). (D) Semiquantitative RT–PCR showing normal ratios of the C-terminal splicing-derived isoforms in the mutant mouse livers (α2 and α8). The PCR primers frame the 30-nucleotide insertion (see Figure 1; (Torres-Padilla et al, 2001)). (E) Western blot performed with liver nuclear extracts of each genotype using an antibody that recognizes all HNF4α isoforms. The HNF4α7 protein migrates faster than the HNF4α1 isoform (arrowheads). *HNF4α protein degradation product or nonspecific signal. Brain nuclear extracts were used as a negative control for the presence of HNF4α proteins and TFIIB as a loading control. (F) Detection of HNF4α isoforms on α7-only liver cryosections (middle) compared to WT and α1-only livers. Immunohistochemistry was performed with the C-terminal antibody used in Western blotting (HNF4α), the α1-specific N1-14 antibody (α1) and an α7-specific antiserum (α7). Arrowhead, bile duct cells. Scale bar, 250 μm.
Figure 3
Figure 3
Weights, serum and bile chemistry, and coagulation tests. (A) A Values obtained (±s.d.) on at least 6 mice (9–13 weeks old), not separated by sex but using equal numbers of males and females. B Assays were performed on male and female groups of 9–16-week-old mice (4⩽n⩽19). When gender-specific differences were obtained while comparing mutant versus WT mice, results from both sexes are shown or specified. C Values obtained with female mice; α7-only males were not significantly affected. D Assays performed on 2–10 males of 14–16 weeks old. E Prothrombin time (PT) and activated partial thromboplastin time (APTT) tests performed on 11–12-week-old mice not separated by sex (n⩾8). Serum and bile chemistry were performed with mice that were fasted overnight. Statistical analyses were performed with GraphPad Instat® software using a one-way analysis of variance test, followed when applicable by the multiple-comparison Dunnett's post-test (*P<0.05 and **P<0.01). BHBA, β-hydroxy butyrate; ALAT, alanine aminotransaminase. (B) Cholesterol in HDL, LDL and VLDL fractions was determined by FPLC on at least three pools of serum from 2–4 males each that were fasted overnight. Results obtained with one representative pool for WT and α7-only mice are shown. Profiles of α1-only mice were not significantly different from WT (not shown). (C) Mice, 5 months old, were either fed ad libitum or fasted for 24 h before killing. Liver cryosections were stained with Oil red O. *Slight lipid accumulation on the WT section, near a centrolobular vein (not shown). All images are at the same magnification (scale bar, 100 μm).
Figure 4
Figure 4
Expression profiles of genes implicated in lipid transport/metabolism in α7-only mouse livers (A–F) and intestine (G) compared to WT tissues. (A–D) Northern blots performed with liver RNA of 9–12-week-old α7-only and WT mice. Quantification of the transcript levels of some genes is shown to the right of the corresponding blot (black and white bars, WT and α7-only livers, respectively). Values were normalized to GAPDH (see (C, D)) and are represented as percentage of the WT samples (n=4–6). GAPDH transcript levels are known to remain stable in the absence of HNF4α (Wiwi et al, 2004). (A–C) Genes implicated in blood triglyceride and cholesterol transport (apolipoproteins), VLDL secretion (apoBEC, MTP), lipoprotein uptake (LDL-R, SR-B1) (A) and fatty acid/cholesterol metabolism (B, C). For (C), expression analysis from 9-week- or 5-month-old mice that were fasted or not (see Figure 3C). ApoBEC, apoB mRNA editing catalytic subunit; LDL-R, LDL-receptor; MTP, microsomal tryglyceride transfer protein; SR-B1, scavenger receptor class B type I receptor; HL, hepatic lipase; LPL, lipoprotein lipase; HMG-Synt/Red, 3-hydroxy-3-methylglutaryl-coenzymeA synthase/reductase; SREBP1c, sterol receptor element binding protein 1c; L-FABP, liver-fatty acid binding protein; MCAD, medium-chain acyl-coA dehydrogenase; CPT II, carnitoyl-palmitoyl transferase II; AOX, acyl-coA oxidase; FAS, fatty acid synthase. (D) Genes involved in bile acid synthesis, excretion and re-uptake from the blood. Cyp7A1, cholesterol 7α hydroxylase; MDR2, multidrug resistance protein 2; NTCP, sodium taurocholate cotransporter protein; OATP1, organic anion transporter protein 1. (E) Quantitative real-time PCR analysis of hepatic apoB transcript amounts (shown as percentage of WT values; n⩾6). (F) Semiquantitative RT–PCR. Hepatic expression of the HNF4α target gene HNF1α and of transcription factors (LXRα/RXRα) known to play an essential role in cholesterol metabolism is shown. No obvious changes in these transcript amounts could be observed in α7-only versus WT livers. LXRα, oxysterol receptor α. (G) Northern blot analysis performed with total RNA from adult mouse intestines. Quantification as for (A–D) (gray bars, α1-only mice; n⩾3).
Figure 5
Figure 5
Expression profile of genes implicated in amino-acid (A) and glucose metabolism (B, C), and of serum protein carriers (D). These genes are known or putative direct targets for the HNF4α or HNF1α transcription factors (Odom et al, 2004 and references therein). TAT, tyrosine aminotransferase; GK, glucokinase; Gys2, glycogen synthase; PEPCK, phosphoenolpyruvate carboxykinase; Alb, albumin; TTR, transthyretin; TFN, transferrin.
Figure 6
Figure 6
CAR expression is strongly diminished in the liver of the α7-only mice. (A) Semiquantitative RT–PCR revealing a decrease in CAR transcript amounts (three isoforms) in α7-only livers compared to WT, whereas expression of PXR is not altered. (B) Quantitative real-time PCR. CAR and PXR transcript amounts are represented relative to the WT values (n⩾3). (C) Northern blot performed with liver RNA of mice that were injected either with TCPOBOP (TC) or vehicle (O). Absence of induction of cyp2b10 was observed in three out of four α7-only mice; the fourth mouse did express cyp2b10 despite very low levels of CAR transcripts (not shown). CAR expression was quantified by real-time PCR, and normalized values are given below the gel for each sample (relative to the non-induced WT mice). (D) EMSA. Cos7 cells were transfected with expression vectors for HNF4α1 or HNF4α7. Amounts of whole-cell extracts were adjusted for HNF4α1 and HNFα7 protein amounts, as deduced from titrations in Western blots (not shown). Oligonucleotides are named according to their 5′ ends relative to the mouse CAR start codon (GenBank contig NT_078306.1) and the sequences of those which clearly bind HNF4α proteins in EMSA are given below the gel. ApoCIII is a well-known HNF4α-binding oligonucleotide. Arrows, HNF4α-DNA complex. Arrowhead, HNF4α1 and α7 supershifts obtained with the antibody-recognizing part of the HNF4α C-terminus domain (Ab). *Nonspecific bands.
Figure 7
Figure 7
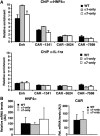
Decreased CAR gene expression in α7-only liver is not due to differences in DNA-binding affinity between HNF4α1 and HNFα7 isoforms. (A) ChIP experiments were performed with livers from WT, α1-only and α7-only female mice (n=2), using the antibody-recognizing part of the HNF4α C-terminus domain (upper panel) or a nonrelevant antibody as a negative control (IL-1ra, lower panel). Similar results were obtained with male mice (not shown). HNF4α binding at the three putative binding sites within the CAR gene 5′ region (Figure 6D) was measured by real-time PCR. Oligonucleotides framing an Hnf4α gene enhancer element (enh) known to bind HNF4α in vivo (A Bailly, personal communication) were used as a positive control for HNF4α binding. (B) Real-time PCR confirming a drastic drop in CAR expression in the liver of α7-only mice used in ChIP assays compared to WT and α1-only livers. Hnf4α expression is constant among genotypes.

References

    1. Barrero MJ, Camarero N, Marrero PF, Haro D (2003) Control of human carnitine palmitoyltransferase II gene transcription by peroxisome proliferator-activated receptor through a partially conserved peroxisome proliferator-responsive element. Biochem J 369: 721–729 - PMC - PubMed
    1. Boj SF, Parrizas M, Maestro MA, Ferrer J (2001) A transcription factor regulatory circuit in differentiated pancreatic cells. Proc Natl Acad Sci USA 98: 14481–14486 - PMC - PubMed
    1. Briancon N, Bailly A, Clotman F, Jacquemin P, Lemaigre FP, Weiss MC (2004) Expression of the α7 isoform of hepatocyte nuclear factor (HNF) 4 is activated by HNF6/OC-2 and HNF1 and repressed by HNF4α1 in the liver. J Biol Chem 279: 33398–33408 - PubMed
    1. Chabardes-Garonne D, Mejean A, Aude JC, Cheval L, Di Stefano A, Gaillard MC, Imbert-Teboul M, Wittner M, Balian C, Anthouard V, Robert C, Segurens B, Wincker P, Weissenbach J, Doucet A, Elalouf JM (2003) A panoramic view of gene expression in the human kidney. Proc Natl Acad Sci USA 100: 13710–13715 - PMC - PubMed
    1. Chen WS, Manova K, Weinstein DC, Duncan SA, Plump AS, Prezioso VR, Bachvarova RF, Darnell JE Jr (1994) Disruption of the HNF-4 gene, expressed in visceral endoderm, leads to cell death in embryonic ectoderm and impaired gastrulation of mouse embryos. Genes Dev 8: 2466–2477 - PubMed

Publication types

MeSH terms