

The latency-associated nuclear antigen of Kaposi sarcoma-associated herpesvirus induces B cell hyperplasia and lymphoma
- PMID: 16498502
- PMCID: PMC1378187
- DOI: 10.1172/JCI26190
The latency-associated nuclear antigen of Kaposi sarcoma-associated herpesvirus induces B cell hyperplasia and lymphoma
Abstract
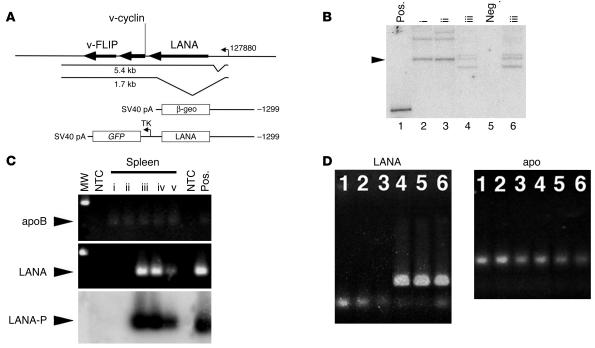
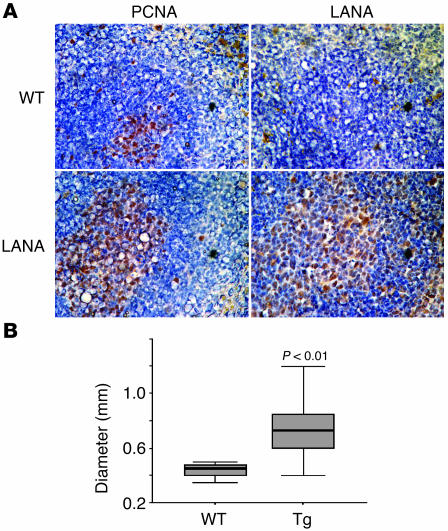
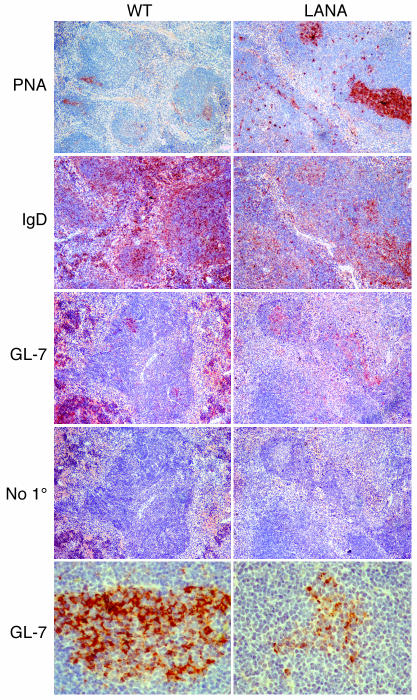
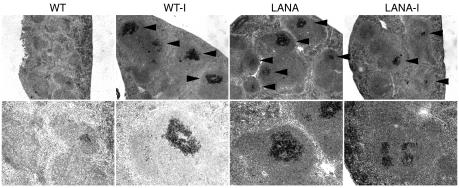
Kaposi sarcoma-associated herpesvirus (KSHV) is a human lymphotropic herpesvirus. It is implicated in B cell neoplasias such as primary effusion lymphoma and multicentric Castleman disease in AIDS patients. The KSHV latency-associated nuclear antigen (LANA) is consistently expressed in all KSHV-associated tumor cells and was shown to bind the tumor suppressor proteins p53 and pRb. To test LANA's contribution to lymphomagenesis in vivo we generated transgenic mice expressing LANA under the control of its own promoter, which is B cell specific. All of the transgenic mice developed splenic follicular hyperplasia due to an expansion of IgM+ IgD+ B cells and showed increased germinal center formation. We also observed lymphomas, implying that LANA can activate B cells and provide the first step toward lymphomagenesis.
Figures
Similar articles
-
KSHV LANA acetylation-selective acidic domain reader sequence mediates virus persistence.Proc Natl Acad Sci U S A. 2020 Sep 8;117(36):22443-22451. doi: 10.1073/pnas.2004809117. Epub 2020 Aug 20. Proc Natl Acad Sci U S A. 2020. PMID: 32820070 Free PMC article.
-
Kaposi's sarcoma-associated herpesvirus LANA2 is a B-cell-specific latent viral protein that inhibits p53.J Virol. 2001 Jan;75(1):429-38. doi: 10.1128/JVI.75.1.429-438.2001. J Virol. 2001. PMID: 11119611 Free PMC article.
-
Kaposi's sarcoma-associated herpesvirus-encoded latency-associated nuclear antigen induces chromosomal instability through inhibition of p53 function.J Virol. 2006 Jan;80(2):697-709. doi: 10.1128/JVI.80.2.697-709.2006. J Virol. 2006. PMID: 16378973 Free PMC article.
-
The Kaposi' s sarcoma-associated herpesvirus latency-associated nuclear antigen.Viral Immunol. 2001;14(4):311-7. doi: 10.1089/08828240152716565. Viral Immunol. 2001. PMID: 11792061 Review.
-
Kaposi sarcoma-associated herpesvirus (human herpesvirus type 8)-associated extracavitary lymphoma: Report of a case in an HIV-positive patient with simultaneous kaposi sarcoma and a review of the literature.Acta Haematol. 2010;123(4):237-41. doi: 10.1159/000314347. Epub 2010 May 19. Acta Haematol. 2010. PMID: 20484888 Review.
Cited by
-
Screening of the Human Kinome Identifies MSK1/2-CREB1 as an Essential Pathway Mediating Kaposi's Sarcoma-Associated Herpesvirus Lytic Replication during Primary Infection.J Virol. 2015 Sep;89(18):9262-80. doi: 10.1128/JVI.01098-15. Epub 2015 Jun 24. J Virol. 2015. PMID: 26109721 Free PMC article.
-
The latency-associated nuclear antigen, a multifunctional protein central to Kaposi's sarcoma-associated herpesvirus latency.Future Microbiol. 2011 Dec;6(12):1399-413. doi: 10.2217/fmb.11.137. Future Microbiol. 2011. PMID: 22122438 Free PMC article. Review.
-
Kaposi's sarcoma-associated herpesvirus latency-associated nuclear antigen interacts with bromodomain protein Brd4 on host mitotic chromosomes.J Virol. 2006 Sep;80(18):8909-19. doi: 10.1128/JVI.00502-06. J Virol. 2006. PMID: 16940503 Free PMC article.
-
The Kaposi's sarcoma-associated herpesvirus LANA protein stabilizes and activates c-Myc.J Virol. 2007 Oct;81(19):10451-9. doi: 10.1128/JVI.00804-07. Epub 2007 Jul 18. J Virol. 2007. PMID: 17634226 Free PMC article.
-
Role of Kaposi's sarcoma-associated herpesvirus C-terminal LANA chromosome binding in episome persistence.J Virol. 2009 May;83(9):4326-37. doi: 10.1128/JVI.02395-08. Epub 2009 Feb 18. J Virol. 2009. PMID: 19225000 Free PMC article.
References
-
- Goedert, J.J. 2000. Infectious causes of cancer. Humana Press. Totowa, New Jersey, USA. 489 pp.
-
- Carbone A, et al. Expression profile of MUM1/IRF4, BCL-6, and CD138/syndecan-1 defines novel histogenetic subsets of human immunodeficiency virus-related lymphomas. Blood. 2001;97:744–751. - PubMed
-
- Klein U, et al. Gene expression profile analysis of AIDS-related primary effusion lymphoma (PEL) suggests a plasmablastic derivation and identifies PEL-specific transcripts. Blood. 2003;101:4115–4121. - PubMed
Publication types
MeSH terms
Substances
Grants and funding
LinkOut - more resources
Full Text Sources
Molecular Biology Databases
Research Materials
Miscellaneous
