. 2006 Apr 10;495(5):511-28.
doi: 10.1002/cne.20888.

Organization of the inferior colliculus of the gerbil (Meriones unguiculatus): differences in distribution of projections from the cochlear nuclei and the superior olivary complex

Affiliations

Organization of the inferior colliculus of the gerbil (Meriones unguiculatus): differences in distribution of projections from the cochlear nuclei and the superior olivary complex

Nell B Cant et al. J Comp Neurol. .

Abstract

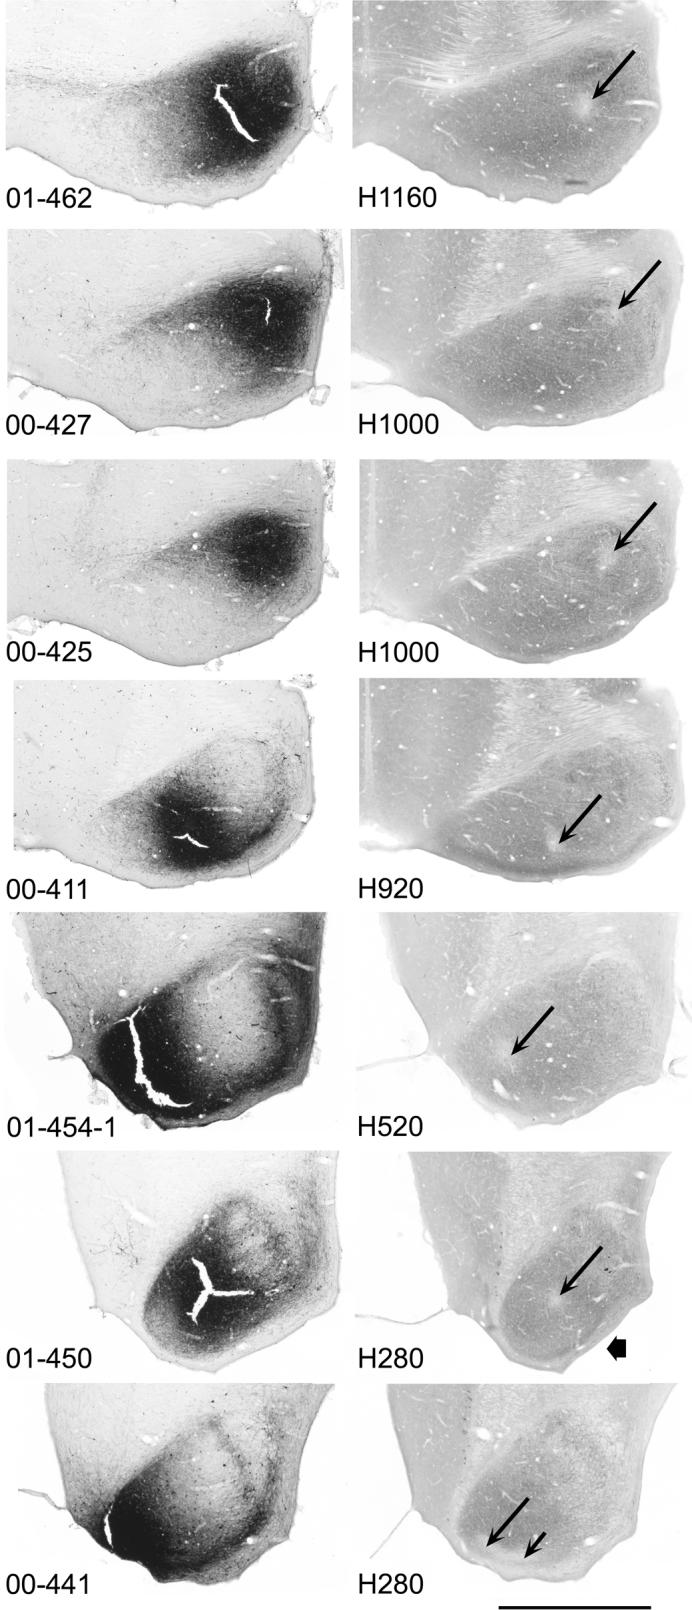
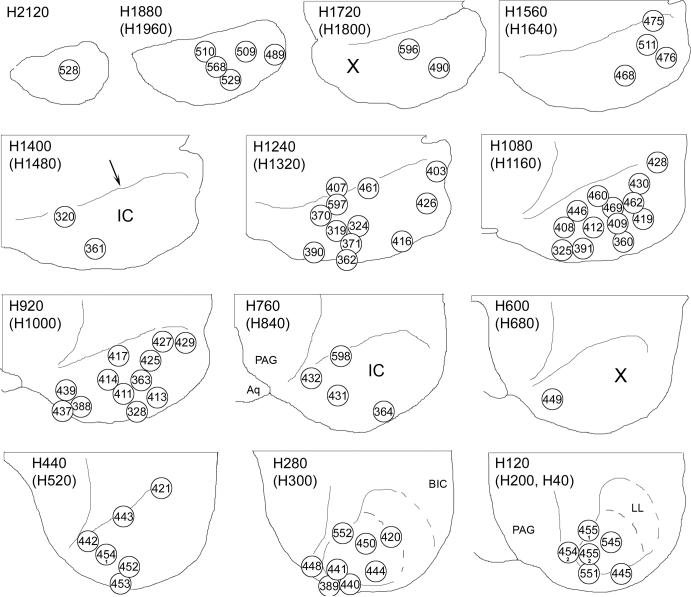
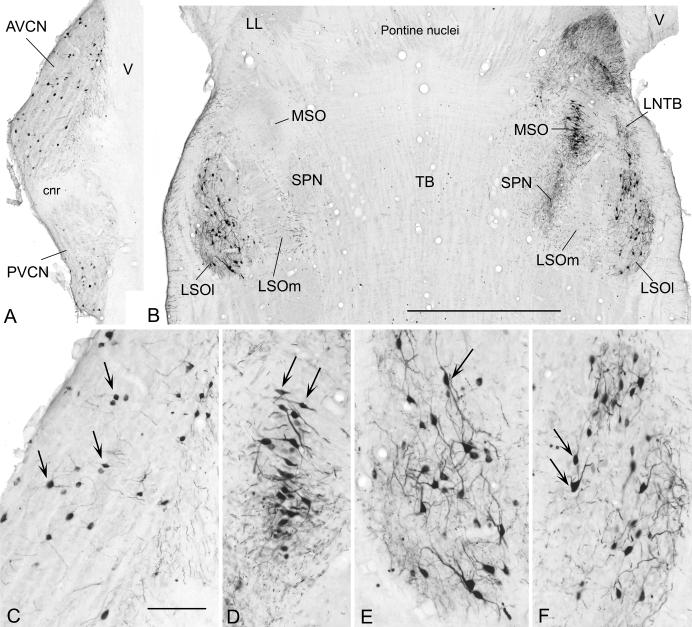
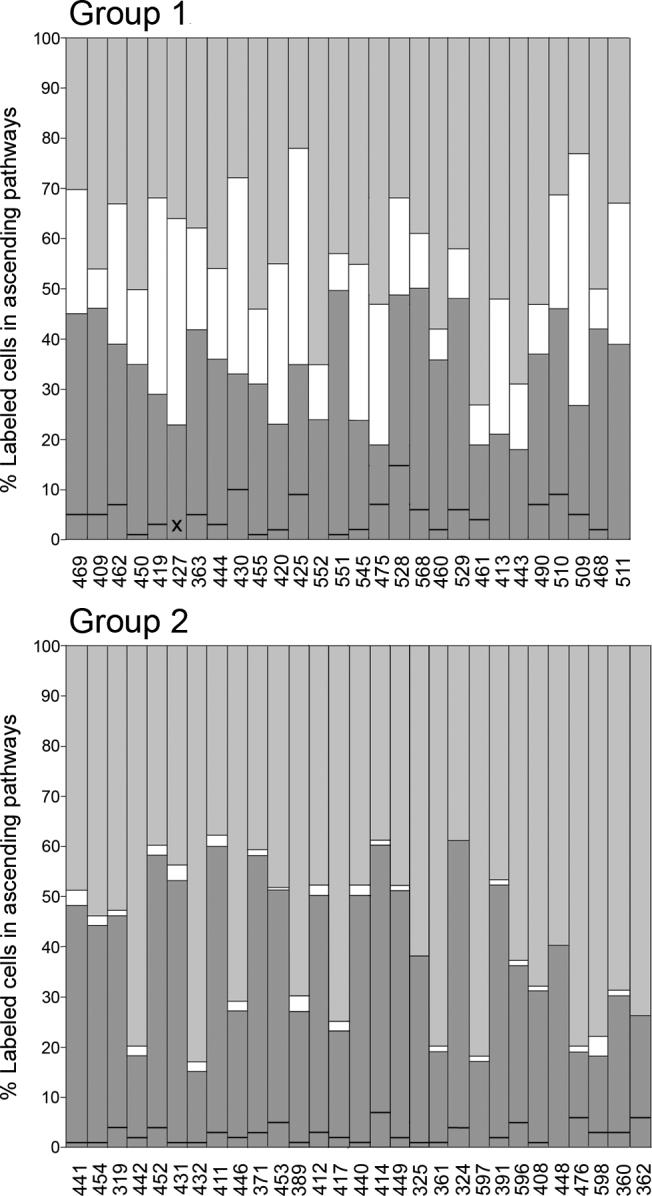
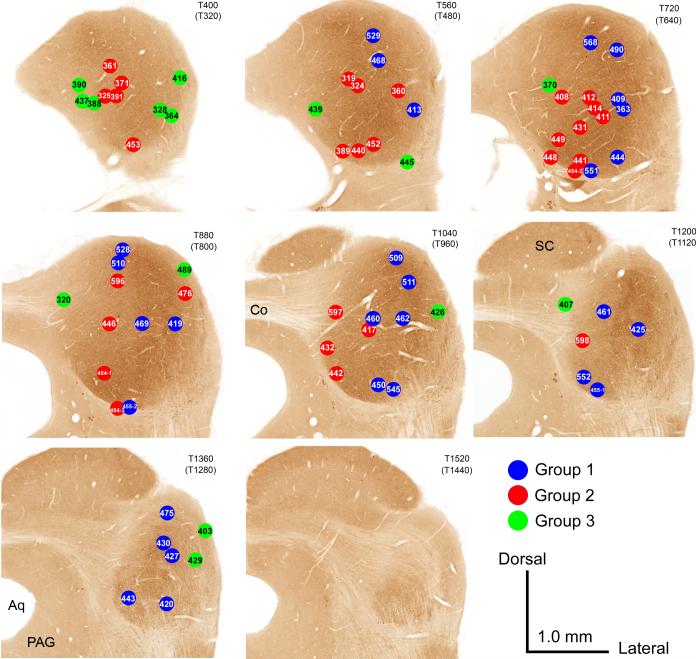
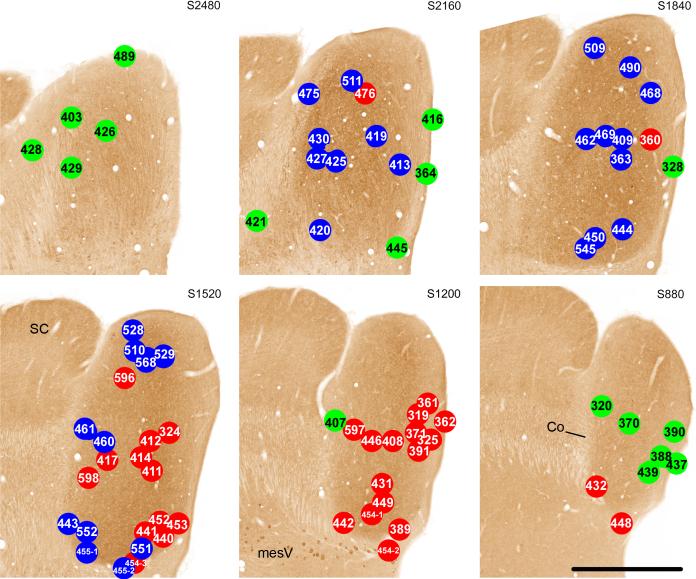
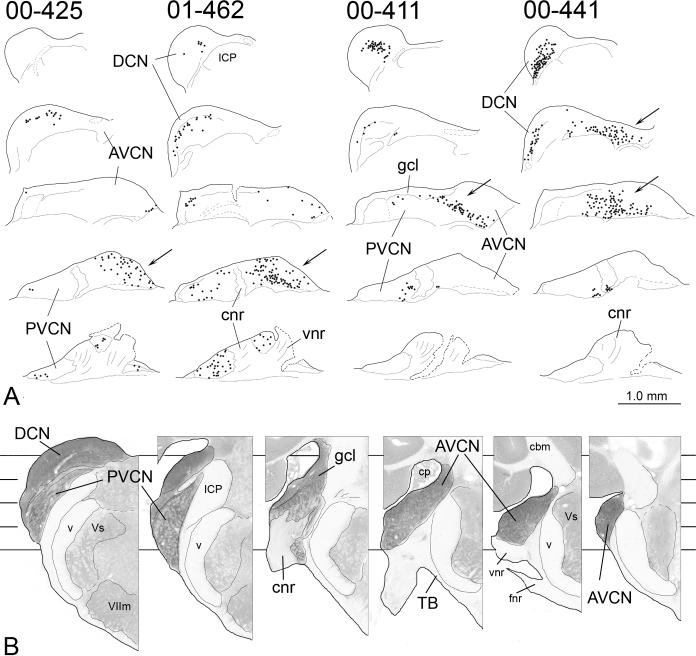
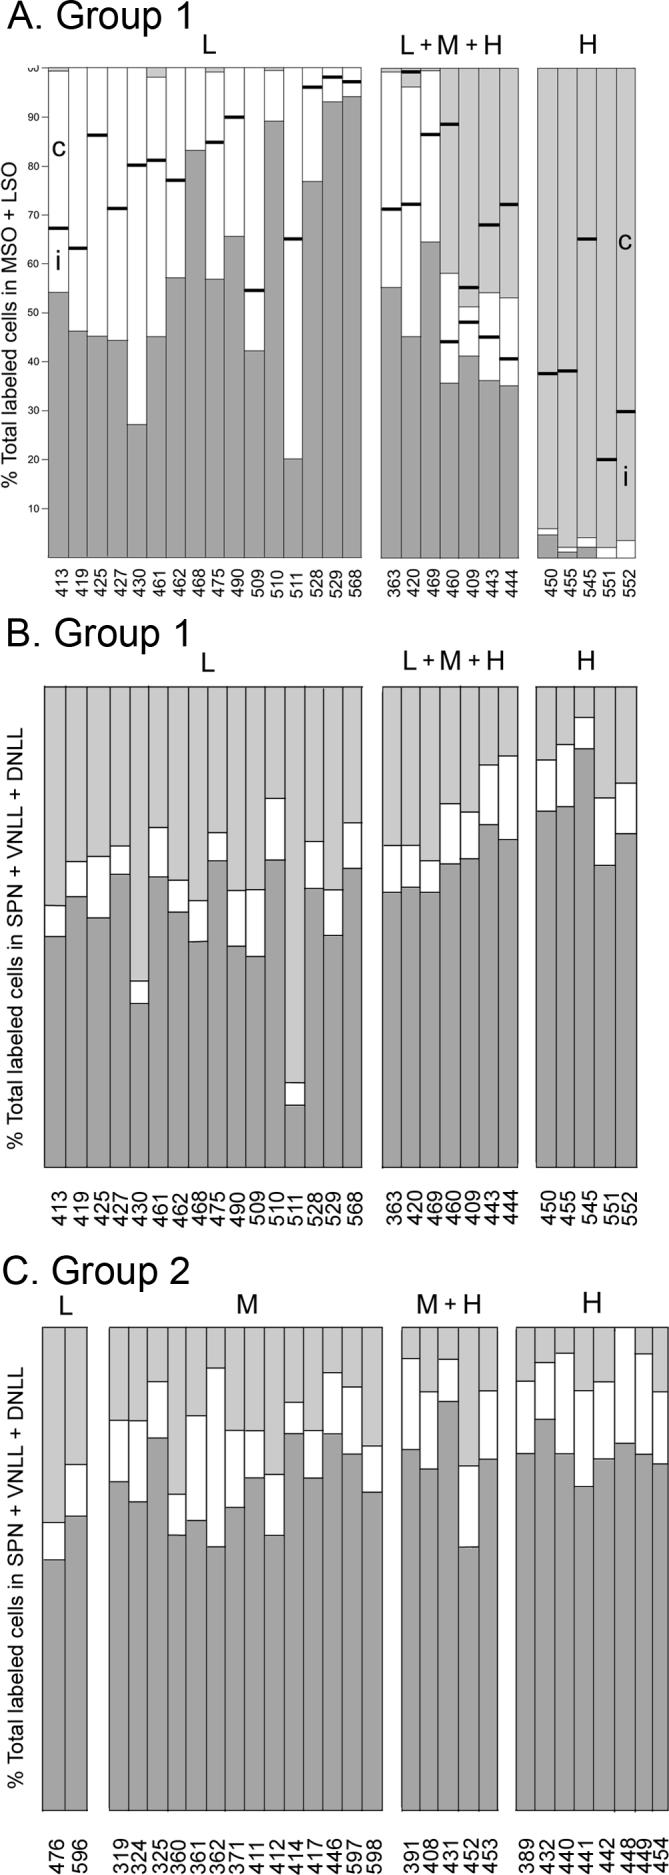
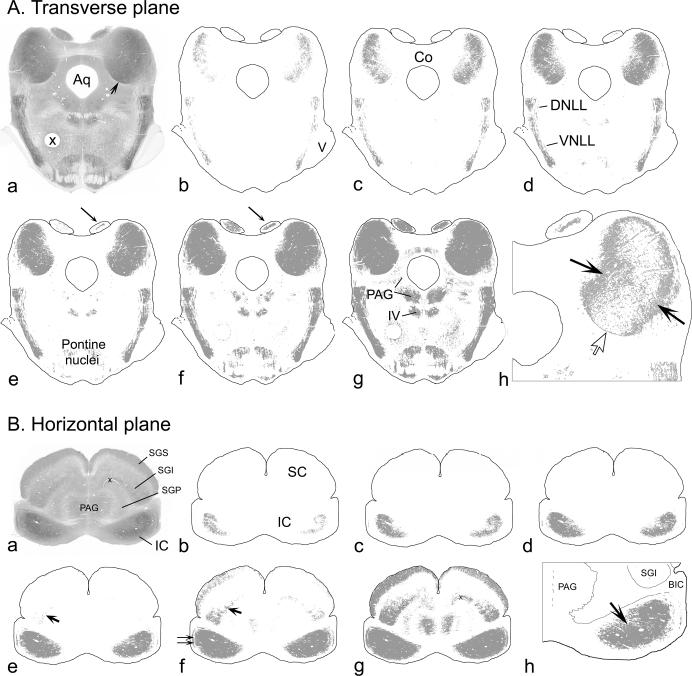
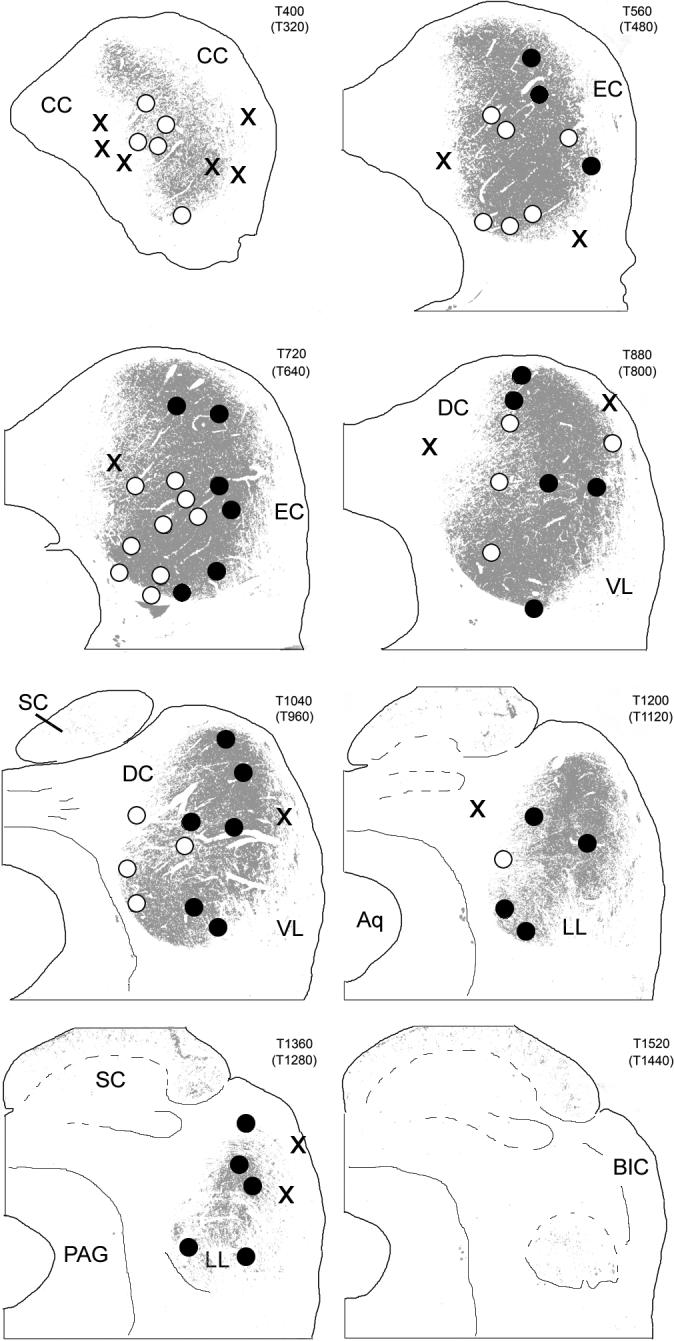
The inferior colliculus (IC) receives its major ascending input from the cochlear nuclei, the superior olivary complex, and the nuclei of the lateral lemniscus. To understand better the terminal distribution of the inputs from these sources relative to one another, we made focal injections of a retrograde tracer, biotinylated dextran amine, in different parts of the IC in 74 gerbils (Meriones unguiculatus). The cases could be divided into three groups based on counts of labeled cells in brainstem auditory nuclei. Group 1 cases had labeled cells in both the cochlear nuclei and the lateral and medial superior olivary nuclei. Group 2 cases had labeled cells in the cochlear nuclei but few or none in the lateral and medial superior olivary nuclei. Both groups had labeled cells in the nuclei of the lateral lemniscus and the superior paraolivary nucleus. Group 3 cases had few labeled cells in any of the ascending auditory pathways. The group to which a case belonged was strongly related to the location of the injection site in the IC. The injection sites for both group 1 and group 2 were located in the central nucleus, but those for group 1 tended to be located laterally relative to those for group 2, which were located more medially and caudally. The injection sites for group 3 cases lay outside the central nucleus of the IC. The two regions of the central nucleus of the IC, distinguished on the basis of connectivity, are likely to subserve different functions.


Figures

Figure 1
Figure 1
Digital photographs of adjacent horizontal sections through the center of the injection site in the right IC in seven cases. Left column: BDA-reacted sections. Right column: CO-reacted sections. The number on the left is the case number for each pair of sections. (The sections shown for case 454 illustrate one of the three injections made in this case.) The number on the right is the number of the comparable section in our atlas of the gerbil IC (Cant and Benson, 2005). Level H1160 is the most dorsal level represented; level H280 is the most ventral. Long thin arrows on each CO-reacted section indicate the CO-depleted spot that marks the location of the pipette tip during the injection. Short thin arrow on the CO-reacted section for case 441 indicates an elongation of the pale region that was probably due to relative brain movement during the injection. The reaction product often built up to such an extent that the tissue became brittle and tore during handling, resulting in cracks like those visible in some of the sections. (The cracks were not a result of the injection itself as they were not present in the CO-reacted sections.) The shape of the CO-reacted section for case 450 was distorted during histological processing (short, thick arrow). For all sections, rostral is toward the top of the figure and lateral is to the right; the midline is at the left side of each panel. Scale bar is equal to approximately 1 mm for all panels.
Figure 2
Figure 2
Distribution of injection sites in the IC. Each panel depicts a horizontal section from our atlas of the gerbil IC (Cant and Benson, 2005). The sections are arranged in rows with the most dorsal section at the top left and the most ventral section at the bottom right. The top number to the upper left of each panel identifies the level of the section in the atlas. All injection sites that were localized to the atlas section depicted and also all of those that were localized to the atlas section dorsal to the one depicted (number in parentheses) are indicated by circles. (On section H120, injection sites from both the adjacent dorsal section and the adjacent ventral section are plotted.) For all sections, rostral is toward the top of the figure and lateral is to the left. A thin line (e.g., arrow on section H1400) indicates the rostral boundary of the IC. The case number (stripped of its prefix) is indicated inside each circle. For cases in which more than one injection was made (453, 454 and 455) a circle is included for the site of each injection that was located within the IC. X, regions that were not well-sampled in this study.
Figure 3
Figure 3
Digital photographs of horizontal sections through the left (contralateral) cochlear nucleus (A) and both sides of the superior olivary complex (B) from case 427 with higher magnification views of the contralateral AVCN (C), the ipsilateral MSO (D), the contralateral LSO (E) and the ipsilateral LSO (F) from the same sections. Labeled neurons (C-F, arrows) stand out darkly against the pale, unstained background. The rostral direction is toward the top of the figure; lateral is toward the left in panel A. Scale on panel B = 1.0 mm and also applies to panel A. Scale on panel C = 200 μm and also applies to panels D-F.
Figure 4
Figure 4
Bar graphs of data from Table 1 plotted as percentages (case numbers are indicated below each bar). Each bar is divided into three parts to show the percent of the total number of cells in brainstem sources (cochlear nuclei, SOC and nuclei of the lateral lemniscus) that were located in the cochlear nuclei (dark gray), in the LSO or MSO (white), and in the superior paraolivary nucleus or nuclei of the lateral lemniscus (light gray). The black line across the dark gray part of each bar divides the contribution from the cochlear nuclei into ipsilateral (below the line) and contralateral (above the line). (For the few cases for which there is no line, all of the labeled cells were located contralaterally.) The cases are divided into groups based on the criteria outlined in the text. The cases are sorted from left to right according to the total number of labeled cells for each group. X, no data are available for the ipsilateral ventral cochlear nucleus in case 427 as it was damaged during processing.
Figure 5
Figure 5
CO-reacted transverse sections through the right IC (atlas sections from Cant and Benson, 2005). The location of the centers of the injection sites for Group 1 cases are indicated in blue; those for Group 2 cases are indicated in red; and those for Group 3 cases are indicated in green. Each panel shows all of the cases that were localized to the section shown (number at the top right of each panel) and also those localized to the section caudal to the one shown (number in parentheses). Dorsal is toward the top of the figure; lateral is toward the right. Scale bar = 1.0 mm for all panels.
Figure 6
Figure 6
CO-reacted parasagittal sections through the right IC (atlas sections from Cant and Benson, 2005). Description as for Figure 7 except that on each panel all of the cases localized both to the section shown (number at top of panel) and also to the two atlas sections medial to it are illustrated. Scale bar = 1.0 mm for all panels.
Figure 7
Figure 7
A. Drawings of evenly spaced horizontal sections through the contralateral cochlear nucleus in four cases. (The injection sites are illustrated in Figure 1.) From top to bottom in each column, the sections are arranged from dorsal to ventral and are located at comparable levels through the nucleus for each case (see Panel B). For each horizontal section, lateral is toward the top of the figure and rostral is toward the right. Sections in each series are separated by 280 μm. Each dot represents at least one labeled cell. Arrows indicate concentrations of labeled cells in the AVCN in each case. Dashed lines on the most ventral sections indicate cut nerve edges or damage to the sections during removal of the brain from the skull. B. Evenly spaced transverse sections through the cochlear nucleus to illustrate the location of the horizontal sections in Panel A. The section on the left is the most caudal in the series; the section on the right is the most rostral. For each section, dorsal is toward the top of the figure and lateral is toward the left. Sections are separated by 360 μm. (In order to make the cochlear nuclear complex stand out, the opacity of surrounding structures was decreased digitally.) Lines running behind the sections indicate the approximate locations of the horizontal sections in Panel A, with the top line at the level of the most dorsal sections and the bottom line at the level of the most ventral sections in the horizontal series. Scale = 1.0 mm for all sections.
Figure 8
Figure 8
Bar graphs illustrating the distribution of labeled cells in the SOC (A) and nuclei of the lateral lemniscus (B, C). Data from Table 1 are re-plotted as percentages. The cases are sorted according to the frequency range to which they were assigned as described in the text. A. Distribution of labeled cells in the LSO and MSO in Group 1 cases. Each bar is divided into parts to show the percentage of the total number of labeled neurons in the main nuclei of the SOC that were located in the ipsilateral MSO (dark gray), the lateral limb of the LSO (white), and the medial limb of the LSO (light gray). The white and light gray portions of the bars are each further divided into two parts to represent the contribution of the ipsilateral LSO (i, portion below the dividing line) and contralateral LSO (c, portion above the line). (For cases where the contribution of the lateral or medial limb was tiny, the laterality is not indicated but can be obtained from Table 1.) B, C. Distribution of labeled cells in the nuclei of the lateral lemniscus and superior paraolivary nucleus in both Group 1 (panel B) and Group 2 (panel C) cases. Each bar is divided into three parts to show the percent of the total number of labeled cells in the superior paraolivary nucleus and the nuclei of the lateral lemniscus that were located in the ipsilateral ventral nucleus of the lateral lemniscus (dark gray), in the ipsilateral superior paraolivary nucleus (white), and in the dorsal nuclei of the lateral lemniscus on both sides (light gray).
Figure 9
Figure 9
Results of setting progressively more inclusive thresholds on digital images of CO-reacted sections through the IC. A.a, Digital image of a transverse section through the midbrain approximately half-way through the rostral to caudal extent of the IC. B.a, Digital image of a horizontal section through the midbrain approximately half-way through the dorsal to ventral extent of the IC. Regions of high CO activity appear dark in these grayscale images, whereas regions with little or no CO activity (e.g. fiber tracts) appear pale. The differences in CO activity translate into differences in grayscale values of the pixels in digital images of the tissue; the higher the activity, the darker (on a scale of 0 to 256 with 0 equal to 100% black) are the pixels in the image. A.b-g. The threshold function in Adobe Photoshop was applied to the image in panel A.a at progressively more inclusive values and the locations of the pixels that were included in the threshold are indicated by the gray fill. A.b, Location of all pixels with a value from 130−135. (There were no pixels with a value less than 130 in this image.) A.c, Location of all pixels with a value from 130 to 145. A.d, 130 to 155. A.e, 130 to 165. Arrow indicates pixels beginning to appear in the caudal-most SC. A.f, 130 to 175. Arrow indicates the growth of the area of inclusion in the SC. A.g, 130 to 185. A.h, A higher magnification view of the right IC. In this image, the location of pixels with values from 155 to 165 is shown in gray; areas with pixels darker than 155 or lighter than 165 remain white. (The pixels shown in gray are those that were added to the central patch going from panel A.d to panel A.e.) The open arrow indicates the location of the sharp boundary at the ventromedial margin of the IC. The filled arrows indicate the medial and lateral fuzzy borders of the dense patch shown in panel A.e (which included all of these pixels). The borders lie between a central area with very few lighter pixels and surrounding areas with almost no darker pixels. B.b-g. The threshold function in Adobe Photoshop was applied to the horizontal image in panel B.a as described for the transverse images. B.b, Location of all pixels with a value from 120 to 140. B.c, 120 to 150. B.d, 120 to 160. B.e, 120 to 170. Large arrow indicates the appearance of the darkest pixels in the SC (in the intermediate layer). B.f, 120 to 180. Large arrow as in panel B.e. Small double arrows indicate patches of dark pixels (high CO activity) in the external cortex of the IC. B.g 120 to 190. B.h, Higher magnification view of the right IC with the threshold set at 170 (as in panel B.e). The gray fill indicates the central CO-rich region of the IC. It is this region that we have defined as the central nucleus (see text). The sections illustrated are at levels T960 (A) and H1160 (B) of our gerbil atlas (Cant and Benson, 2005). For the transverse section, the dorsal direction is toward the top of the figure. For the horizontal section, the rostral direction is toward the top of the figure.
Figure 10
Figure 10
Distribution of injection sites with respect to the location of the central nucleus of the IC (as defined in the text). Transverse sections through the IC are the same as those illustrated in Figure 5. The large central patch of gray fill represents all pixels in the image that were captured by a threshold set just at the point at which pixels in the superior colliculus began to be included (see text). The centers of the injection sites for 71 of the cases are indicated by dots. Black dots: Injection sites for Group 1 cases, in which > 15% of labeled cells in the ascending pathways were located in the cochlear nuclei and > 5% were located in the LSO and MSO. White dots: Injection sites for Group 2 cases, in which > 15% of labeled cells in the ascending pathways were located in the cochlear nuclei but < 5% were located in the LSO and MSO. X, Injection sites for Group 3 cases, in which few labeled cells were found in the cochlear nuclei or in the superior olivary complex.

References

    1. Adams JC. Ascending projections to the inferior colliculus. J. Comp. Neurol. 1979;183:519–538. - PubMed
    1. Adams JC. Crossed and descending projections to the inferior colliculus. Neurosci. Lett. 1980;19:1–5. - PubMed
    1. Adams JC. Heavy metal intensification of DAB-based HRP reaction product. J. Histochem. Cytochem. 1981;29:775. - PubMed
    1. Aitkin LM, Schuck D. Low frequency neurons in the lateral central nucleus of the cat inferior colliculus receive their input predominantly from the medial superior olive. Hearing Res. 1985;17:87–93. - PubMed
    1. Bajo VM, Moore DR. Descending projections from the auditory cortex to the inferior colliculus in the gerbil, Meriones unguiculatus. J. Comp. Neurol. 2005;486:101–116. - PubMed

Publication types