How well do adolescents determine portion sizes of foods and beverages?
- PMID: 16500876
- PMCID: PMC2684582
How well do adolescents determine portion sizes of foods and beverages?
Abstract
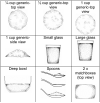
In the present study, we examined how well adolescents (12-13 years) are able to select the correct dietary aid portion sizes after having been shown different food items. We also evaluated the effectiveness of two-dimensional life-size drawings and three-dimensional food models, used as dietary aids in this process. Fifty black children and 42 white children from Johannesburg participated in the study (N = 92). Trained interviewers individually tested each child following a prescribed sequence, throughout. Each participant was shown a plate of actual food of a pre-determined weight. The participant was required to select a two-dimensional drawing, and thereafter a three-dimensional food model, which most closely resembled the real food portion. In this manner, portion size estimation was evaluated with respect to 11 different food items. Correlations between nutrients calculated from actual weight of food portions and estimates ranged from 0.842 to 0.994 (P < 0.0001), indicating a significant positive linear association between the actual and estimated nutrients, using either of the dietary aids. However, findings also suggest that the drawings provided a better estimate of actual energy, fat and carbohydrates than did the food models (with respect to lying within the limits of agreement). On the other hand, the food models were more frequently selected correctly than the drawings. Hence, both methods had advantages and disadvantages. Overall, it was found that there were no gender differences (P < 0.05) when using either the models or drawings to estimate portion size, however, there were significant ethnic differences (P < 0.05). With two exceptions, black children selected the correct aids (drawings and models), more often compared with white children. It is recommended that in dietary interviews undertaken in black children in urban areas one could use either aid; while in white adolescents the use of the food models is recommended.
Figures
Similar articles
-
Comparison of known food weights with image-based portion-size automated estimation and adolescents' self-reported portion size.J Diabetes Sci Technol. 2012 Mar 1;6(2):428-34. doi: 10.1177/193229681200600231. J Diabetes Sci Technol. 2012. PMID: 22538157 Free PMC article.
-
Accuracy of food photographs for quantifying food servings in a lunch meal setting among Danish children and adults.J Hum Nutr Diet. 2018 Feb;31(1):131-140. doi: 10.1111/jhn.12490. Epub 2017 Jun 27. J Hum Nutr Diet. 2018. PMID: 28656744
-
Food photographs in portion size estimation among adolescent Mozambican girls.Public Health Nutr. 2013 Sep;16(9):1558-64. doi: 10.1017/S1368980012003655. Epub 2012 Aug 8. Public Health Nutr. 2013. PMID: 22874096 Free PMC article.
-
Measuring food intake with digital photography.J Hum Nutr Diet. 2014 Jan;27 Suppl 1(0 1):72-81. doi: 10.1111/jhn.12014. Epub 2013 Jul 15. J Hum Nutr Diet. 2014. PMID: 23848588 Free PMC article. Review.
-
A systematic review of recall errors associated with portion size estimation aids in children.Appetite. 2020 Apr 1;147:104522. doi: 10.1016/j.appet.2019.104522. Epub 2019 Nov 18. Appetite. 2020. PMID: 31751634
Cited by
-
Adiposity Mediates the Association between the Dietary Inflammatory Index and Markers of Type 2 Diabetes Risk in Middle-Aged Black South African Women.Nutrients. 2019 May 31;11(6):1246. doi: 10.3390/nu11061246. Nutrients. 2019. PMID: 31159253 Free PMC article.
-
Development and validation of a photographic food atlas for portion size assessment in the southern plains of Nepal.Public Health Nutr. 2016 Oct;19(14):2495-507. doi: 10.1017/S1368980016000537. Epub 2016 Mar 21. Public Health Nutr. 2016. PMID: 26996822 Free PMC article.
-
The Influence of Maternal Dietary Patterns on Body Mass Index and Gestational Weight Gain in Urban Black South African Women.Nutrients. 2017 Jul 11;9(7):732. doi: 10.3390/nu9070732. Nutrients. 2017. PMID: 28696364 Free PMC article.
-
A maternal "mixed, high sugar" dietary pattern is associated with fetal growth.Matern Child Nutr. 2020 Apr;16(2):e12912. doi: 10.1111/mcn.12912. Epub 2019 Nov 27. Matern Child Nutr. 2020. PMID: 31777191 Free PMC article.
-
COVID-19 and Virtual Nutrition: A Pilot Study of Integrating Digital Food Models for Interactive Portion Size Education.Nutrients. 2022 Aug 12;14(16):3313. doi: 10.3390/nu14163313. Nutrients. 2022. PMID: 36014819 Free PMC article.
References
-
- Nelson M, Bingham S. Assessment of food consumption and nutrient intake. In: Margetts B, Nelson M, editors. Design Concepts in Nutritional Epidemiology. 2nd Ed. London: Oxford University Press; 1997.
-
- Livingstone MBE, Robson PJ. Measurement of dietary intake in children. Proc Nutr Soc. 2000;59:279–293. - PubMed
-
- Rutishauser IHE. Food models, photographs, or household measures? Proc Nutr Soc. 1982;7:144.
-
- Venter CS, MacIntyre UE, Vorster HH. The development and testing of a food portion photograph book for use in an African population. J Hum Nutr Diet. 2000;13:205–218. - PubMed
-
- Nelson M, Haraldsdottir J. Food photographs: practical guidelines I. Design and analysis of studies to validate portion size estimates. Public Health Nutr. 1998;1(4):219–230. - PubMed
Publication types
MeSH terms
Grants and funding
LinkOut - more resources
Full Text Sources


