Infrared spectroscopy with multivariate analysis potentially facilitates the segregation of different types of prostate cell
- PMID: 16500983
- PMCID: PMC1440759
- DOI: 10.1529/biophysj.105.077255
Infrared spectroscopy with multivariate analysis potentially facilitates the segregation of different types of prostate cell
Erratum in
- Biophys J. 2006 Jul 15;91(2):775
Abstract
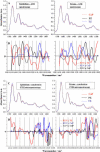
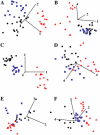
The prostate gland is conventionally divided into zones or regions. This morphology is of clinical significance as prostate cancer (CaP) occurs mainly in the peripheral zone (PZ). We obtained tissue sets consisting of paraffin-embedded blocks of cancer-free transition zone (TZ) and PZ and adjacent CaP from patients (n = 6) who had undergone radical retropubic prostatectomy; a seventh tissue set of snap-frozen PZ and TZ was obtained from a CaP-free gland removed after radical cystoprostatectomy. Paraffin-embedded tissue slices were sectioned (10-mum thick) and mounted on suitable windows to facilitate infrared (IR) spectra acquisition before being dewaxed and air dried; cryosections were dessicated on BaF(2) windows. Spectra were collected employing synchrotron Fourier-transform infrared (FTIR) microspectroscopy in transmission mode or attenuated total reflection-FTIR (ATR) spectroscopy. Epithelial cell and stromal IR spectra were subjected to principal component analysis to determine whether wavenumber-absorbance relationships expressed as single points in "hyperspace" might on the basis of multivariate distance reveal biophysical differences between cells in situ in different tissue regions. After spectroscopic analysis, plotted clusters and their loadings curves highlighted marked variation in the spectral region containing DNA/RNA bands ( approximately 1490-1000 cm(-1)). By interrogating the intrinsic dimensionality of IR spectra in this small cohort sample, we found that TZ epithelial cells appeared to align more closely with those of CaP while exhibiting marked structural differences compared to PZ epithelium. IR spectra of PZ stroma also suggested that these cells are structurally more different to CaP than those located in the TZ. Because the PZ exhibits a higher occurrence of CaP, other factors (e.g., hormone exposure) may modulate the growth kinetics of initiated epithelial cells in this region. The results of this pilot study surprisingly indicate that TZ epithelial cells are more likely to exhibit what may be a susceptibility-to-adenocarcinoma spectral signature. Thus, IR spectroscopy on its own may not be sufficient to identify premalignant prostate epithelial cells most likely to progress to CaP.
Figures


Similar articles
-
Discrimination of zone-specific spectral signatures in normal human prostate using Raman spectroscopy.Analyst. 2010 Dec;135(12):3060-9. doi: 10.1039/c0an00518e. Epub 2010 Oct 15. Analyst. 2010. PMID: 20949203
-
Segregation of human prostate tissues classified high-risk (UK) versus low-risk (India) for adenocarcinoma using Fourier-transform infrared or Raman microspectroscopy coupled with discriminant analysis.Anal Bioanal Chem. 2011 Aug;401(3):969-82. doi: 10.1007/s00216-011-5123-z. Epub 2011 Jun 4. Anal Bioanal Chem. 2011. PMID: 21643857
-
Applications of Fourier transform infrared microspectroscopy in studies of benign prostate and prostate cancer. A pilot study.J Pathol. 2003 Sep;201(1):99-108. doi: 10.1002/path.1421. J Pathol. 2003. PMID: 12950022
-
Zonal origin of prostatic adenocarcinoma: are there biologic differences between transition zone and peripheral zone adenocarcinomas of the prostate gland?J Cell Biochem Suppl. 1994;19:267-9. J Cell Biochem Suppl. 1994. PMID: 7823599 Review.
-
Application of multivariate data-analysis techniques to biomedical diagnostics based on mid-infrared spectroscopy.Anal Bioanal Chem. 2008 Jul;391(5):1641-54. doi: 10.1007/s00216-008-1989-9. Epub 2008 Apr 1. Anal Bioanal Chem. 2008. PMID: 18379763 Review.
Cited by
-
Distinguishing cell types or populations based on the computational analysis of their infrared spectra.Nat Protoc. 2010 Nov;5(11):1748-60. doi: 10.1038/nprot.2010.133. Epub 2010 Oct 7. Nat Protoc. 2010. PMID: 21030951
-
Label-free characterization of cancer-activated fibroblasts using infrared spectroscopic imaging.Biophys J. 2011 Sep 21;101(6):1513-21. doi: 10.1016/j.bpj.2011.07.055. Epub 2011 Sep 20. Biophys J. 2011. PMID: 21943433 Free PMC article.
-
Bioactivity, Efficacy, and Safety of a Wound Healing Ointment With Medicinal Plant Bioactives: In Vitro and In Vivo Preclinical Evaluations.ScientificWorldJournal. 2025 Feb 26;2025:9466270. doi: 10.1155/tswj/9466270. eCollection 2025. ScientificWorldJournal. 2025. PMID: 40225352 Free PMC article.
-
Computational chemical imaging for cardiovascular pathology: chemical microscopic imaging accurately determines cardiac transplant rejection.PLoS One. 2015 May 1;10(5):e0125183. doi: 10.1371/journal.pone.0125183. eCollection 2015. PLoS One. 2015. PMID: 25932912 Free PMC article.
-
Grading of intrinsic and acquired cisplatin-resistant human melanoma cell lines: an infrared ATR study.Eur Biophys J. 2011 Jun;40(6):795-804. doi: 10.1007/s00249-011-0695-2. Epub 2011 Apr 7. Eur Biophys J. 2011. PMID: 21472431
References
-
- McNeal, J. E. 1988. Normal histology of the prostate. Am. J. Surg. Pathol. 12:619–633. - PubMed
-
- McNeal, J. E. 1988. The prostate gland: morphology and pathobiology. Monograph Urol. 9:36–63.
-
- Ragavan, N., R. Hewitt, L. J. Cooper, K. M. Ashton, A. C. Hindley, C. M. Nicholson, N. J. Fullwood, S. S. Matanhelia, and F. L. Martin. 2004. CYP1B1 expression in prostate is higher in the peripheral than in the transition zone. Cancer Lett. 215:69–78. - PubMed
-
- Office for National Statistics. 1996. Mortality Statistics by Cause: England and Wales 1996. Series DH2, No. 23. Her Majesty's Stationary Office, London, UK.
-
- American Cancer Society. 1991. Cancer Facts and Figures—1991. ACS, Atlanta, GA.
Publication types
MeSH terms
Substances
LinkOut - more resources
Full Text Sources
Medical
Miscellaneous

