. 2006 May 15;90(10):3447-68.
doi: 10.1529/biophysj.105.077073. Epub 2006 Feb 24.

Ion permeation through a narrow channel: using gramicidin to ascertain all-atom molecular dynamics potential of mean force methodology and biomolecular force fields

Affiliations

Ion permeation through a narrow channel: using gramicidin to ascertain all-atom molecular dynamics potential of mean force methodology and biomolecular force fields

Toby W Allen et al. Biophys J. .

Abstract

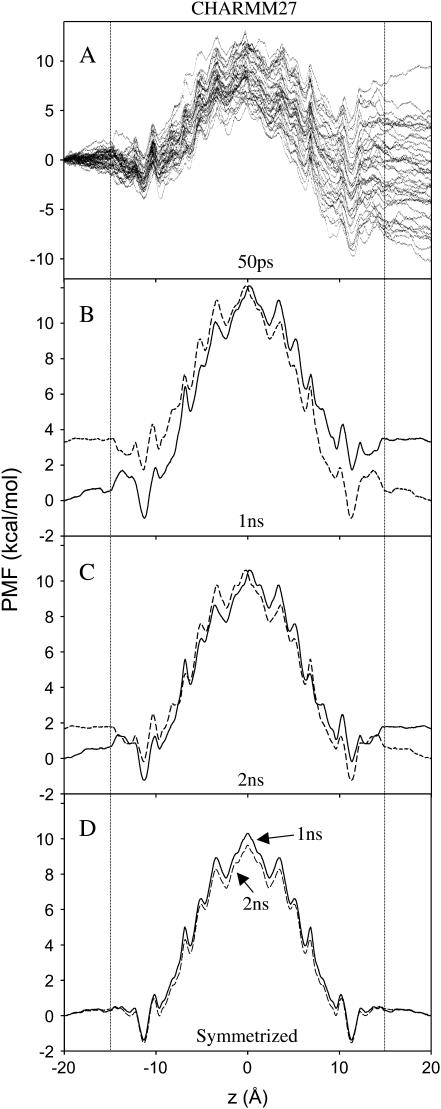
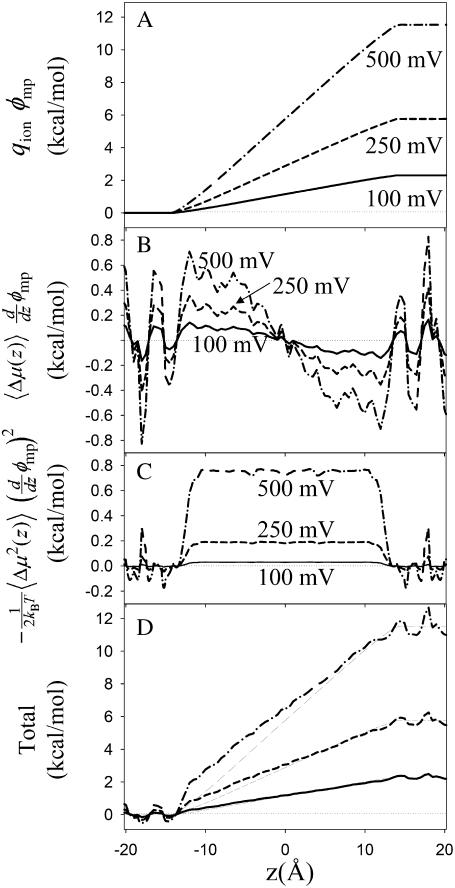
We investigate methods for extracting the potential of mean force (PMF) governing ion permeation from molecular dynamics simulations (MD) using gramicidin A as a prototypical narrow ion channel. It is possible to obtain well-converged meaningful PMFs using all-atom MD, which predict experimental observables within order-of-magnitude agreement with experimental results. This was possible by careful attention to issues of statistical convergence of the PMF, finite size effects, and lipid hydrocarbon chain polarizability. When comparing the modern all-atom force fields of CHARMM27 and AMBER94, we found that a fairly consistent picture emerges, and that both AMBER94 and CHARMM27 predict observables that are in semiquantitative agreement with both the experimental conductance and dissociation coefficient. Even small changes in the force field, however, result in significant changes in permeation energetics. Furthermore, the full two-dimensional free-energy surface describing permeation reveals the location and magnitude of the central barrier and the location of two binding sites for K(+) ion permeation near the channel entrance--i.e., an inner site on-axis and an outer site off-axis. We conclude that the MD-PMF approach is a powerful tool for understanding and predicting the function of narrow ion channels in a manner that is consistent with the atomic and thermally fluctuating nature of proteins.


Figures

FIGURE 1
FIGURE 1
Gramicidin A in the bilayer: (A) one-shell system: gA dimer (yellow); DMPC bilayer atoms C (gray), O (red), N (blue), and P (green); K+ (green spheres) and Cl (gray spheres); water O (red) and H (white). Within the channel, seven single-file water molecules are drawn as spheres adjacent to a single K+ ion at the channel entrance. The chosen MD frame has a channel axis with tilt angle ∼9° relative to the membrane normal vector z. Some lipid molecules and electrolyte from neighboring images are visible. (B) One-shell system (CPK color with green lipid C atoms) with hexagonal periodic images (CPK color with gray lipid C atoms) viewed along the membrane normal. Water molecules and ions have been removed for clarity. (C) Three-shell (large) system with hexagonal periodic images.
FIGURE 2
FIGURE 2
Observed rotameric states of the Trp-9 residues in the gA channel during 47 ns of unbiased simulation (adapted from (20)). The solid box highlights the correct rotameric state and indicates the placement of a two-dimensional flat-bottomed restraint to maintain this rotamer during PMF calculations.
FIGURE 3
FIGURE 3
Density of lipid heavy atoms around the gA dimer. Density is plotted as a two-dimensional histogram in axial and radial directions with respect to the protein. The one-shell histogram is an average over 10 ns of simulation whereas the three-shell system is an average over only the first 2 ns of a 10-ns simulation to highlight the presence of a lipid density over the channel entrance.
FIGURE 4
FIGURE 4
One-dimensional PMFs from simulations with the CHARMM27 force field (without artifact correction). (A) PMFs for all 40 × 50 ps blocks in the total of 2 ns simulation/window. Panels B and C reveal asymmetry in the PMF for 1 and 2 ns per window, respectively, by plotting with the mirror image about z = 0 (dashed curves). The symmetrized PMFs for 1 and 2 ns are shown in panel D. Broken vertical lines at |z| = 15 Å indicate that the one-dimensional PMF is not defined approximately beyond those points.
FIGURE 5
FIGURE 5
Creating a two-dimensional PMF. (A) The PMF obtained from two-dimensional unbiasing of equilibrium distributions from umbrella sampling simulations. (B) The PMF obtained by analysis of bulk ion densities. (C) A blend of panels A and B using linear interpolation, similar to that in Allen et al. (15), but with extended range.
FIGURE 6
FIGURE 6
Average channel tilt angle (from average cosine of the angle separating the channel axis and membrane normal, z) as a function of ion position z for the small, one-shell, system. Results have been symmetrized by averaging windows on each side of z = 0. Error bars are not shown for clarity. The average standard deviation in ion position is 0.25 Å and that of tilt angle is 3.6°.
FIGURE 7
FIGURE 7
Two-dimensional PMFs in the pore region for two different reaction coordinates: the position along the instantaneous channel axis (monomer center-of-mass to the monomer center-of-mass) (A), and the projection of the distance to the center-of-mass onto the membrane normal, the z-axis (B). Each surface is based on a calculation with a symmetrized biased density. Only the first 1 ns of simulation for each window is included.
FIGURE 8
FIGURE 8
One-dimensional PMFs from simulations with the CHARMM27 force field (without artifact corrections) using two different reaction coordinates: the position along the instantaneous channel axis (solid) and the projection of the distance from the center of mass onto the membrane normal, z (dashed). Each curve has been symmetrized (via biased density) and only the first 1 ns of simulation for each window is included.
FIGURE 9
FIGURE 9
The free energy cycle illustrates the sequence of correction calculations required for a PMF calculated with finite system size and nonpolarizable membrane. The gA channel is shown as yellow; high dielectric (ε = 80) bulk water as blue; membrane core with ε = 1 as white; membrane core with correct hydrocarbon dielectric constant (ε = 2) as gray; pore water molecules as red (O) and white (H) circles; and K+ as green circles with + sign.
FIGURE 10
FIGURE 10
Corrections applied to the one-dimensional PMF to correct for simulation artifacts. (A) Poisson size correction (one shell of lipids → infinite bilayer); (B) Poisson membrane dielectric constant correction (εm = 1 → 2); (C) Poisson-Boltzmann concentration correction (1 M → 0.1 M). Data points represent calculations which are ensemble averages of Poisson solutions using a set of MD protein and channel-water coordinates. Short-dashed curves in panels A and B are corrections that use a single MD-averaged structure with the dielectric constant of the protein and channel water of 1. Long-dashed curves are corrections that assume the dielectric constant of the protein and channel water to be 2. The solid curves in panels A and B employ protein/channel-water dielectric constants of 1.25 and 1.75, respectively, as a fit to the calculated MD averages. In panel C, the dielectric constant was assumed to be 1.5.
FIGURE 11
FIGURE 11
(A) One-dimensional CHARMM27 PMFs (from 1 ns simulation per window) before (dashed) and after (solid) artifact corrections. The dotted curve shows the corrected PMF with scaled hydrocarbon dielectric correction (see text) to be referred to as the “Drude-corrected” CHARMM27 PMF. (B) comparison of PMFs, before and after corrections, between small (20 lipids, red) and large (96 lipid, blue) membranes. The PMFs have been matched at z = 20 Å. PMFs from 2 ns/window simulation (not shown) experience barriers that are 0.7 kcal/mol less than the plotted 1 ns/window PMFs (with or without Drude-oscillator-scaled corrections).
FIGURE 12
FIGURE 12
Terms in the cumulant expansion Eq. 6. (A) The membrane potential for 100 mV (solid), 250 mV (dashed), and 500 mV (dash-dot) applied potential difference from solutions to the modified Poisson-Boltzmann equation with MD-averaged structure. The linear dipole (B) and quadratic dipole (C) cumulant corrections are shown in panels B and C, respectively. The sum of all terms for each voltage difference are plotted in panel D as thick curves. The thin curves superimposed in panel D are the qionφmp terms from panel A.
FIGURE 13
FIGURE 13
K+ ion diffusion profile. Calculated values of the axial component of the ion diffusion coefficient, for each window simulation, are drawn with a solid line. All values have been symmetrized (unlike Fig. 6 in (15)) and scaled relative to the calculated bulk value of 0.37 Å2/ps. The fit (dashed line) is a sigmoidal function.
FIGURE 14
FIGURE 14
One-dimensional PMFs using the CHARMM27, AMBER94, and GROMOS87 force fields. All PMFs have been calculated from 1-ns/window simulations and have been corrected for simulation artifacts.
FIGURE 15
FIGURE 15
One-dimensional PMFs using the CHARMM27 force field and variations CHARMM27+ and CHARMM27−. The dashed curve uses the CHARMM27+ force field (as defined in Table 2 with modification to K+-O Lennard-Jones interaction). The dash-dot curve uses the CHARMM27− force field, also defined in Table 2. All PMFs have been calculated from 1-ns/window simulations and have been corrected for simulation artifacts.

Similar articles

Cited by

References

    1. Karplus, M. 2002. Molecular dynamics simulations of biomolecules. Acc. Chem. Res. 35:321–323. - PubMed
    1. Roux, B., T. Allen, S. Bernèche, and W. Im. 2004. Theoretical and computational models of biological ion channels. Q. Rev. Biophys. 37:15–103. - PubMed
    1. Allen, T. W., O. S. Andersen, and B. Roux. 2004. On the importance of flexibility in studies of ion permeation. J. Gen. Physiol. 124:679–690. - PMC - PubMed
    1. Lindorff-Larsen, K., R. Best, M. Depristo, C. Dobson, and M. Vendruscolo. 2005. Simultaneous determination of protein structure and dynamics. Nature. 433:128–132. - PubMed
    1. Karplus, M., and J. McCammon. 1981. The internal dynamics of globular proteins. CRC Crit. Rev. Biochem. 9:293–349. - PubMed

Publication types

LinkOut - more resources