. 2006 Mar;15(3):583-601.
doi: 10.1110/ps.051774906.

Automated extraction of backbone deuteration levels from amide H/2H mass spectrometry experiments

Affiliations

Automated extraction of backbone deuteration levels from amide H/2H mass spectrometry experiments

Matthew Hotchko et al. Protein Sci. 2006 Mar.

Abstract

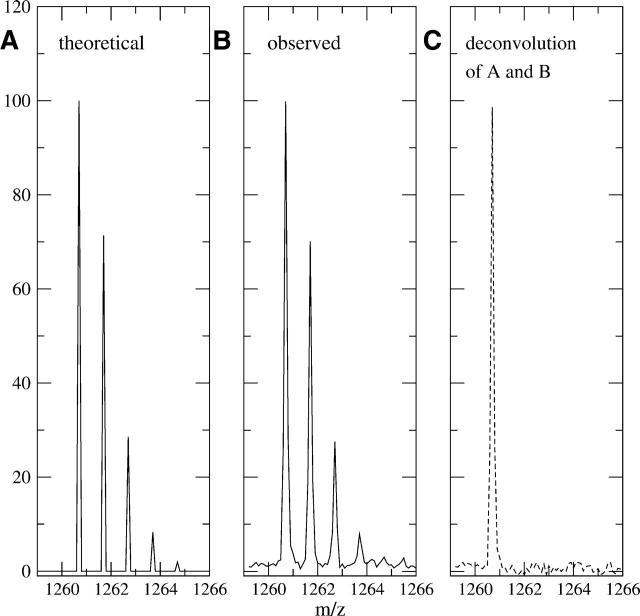
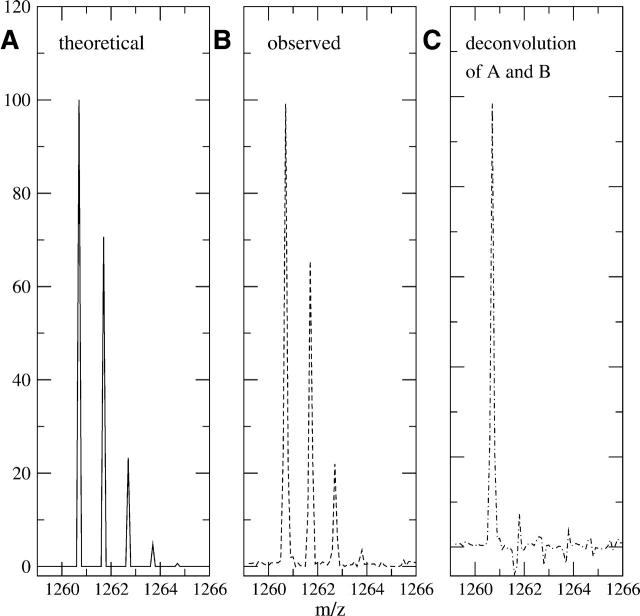
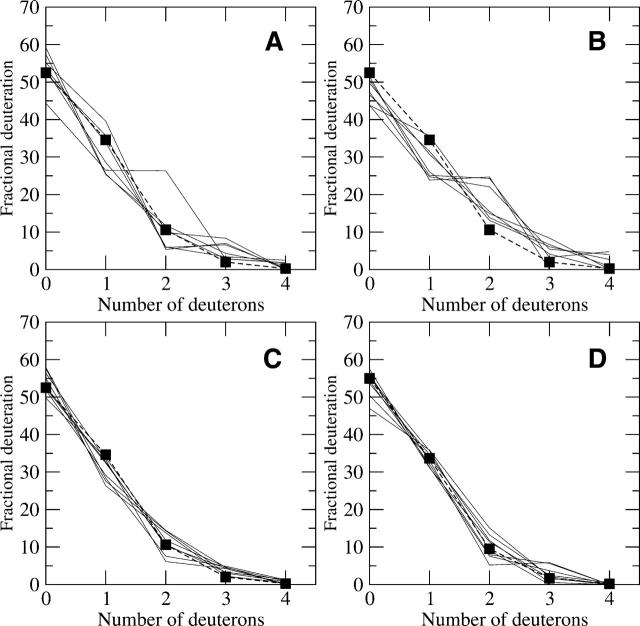
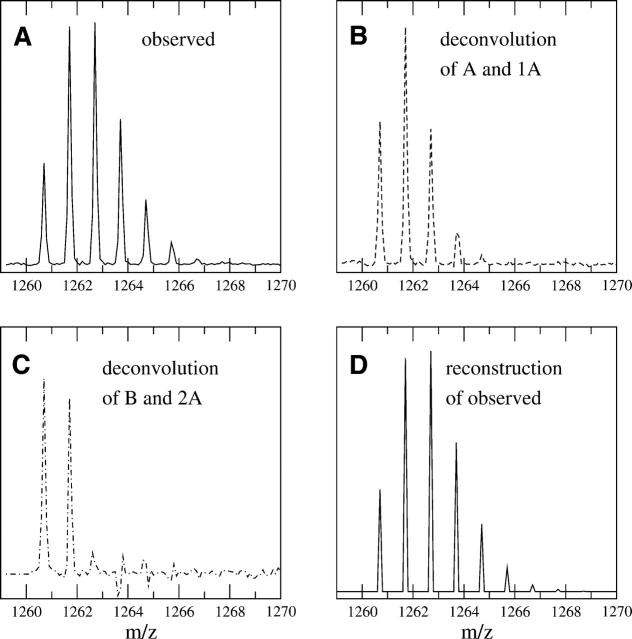
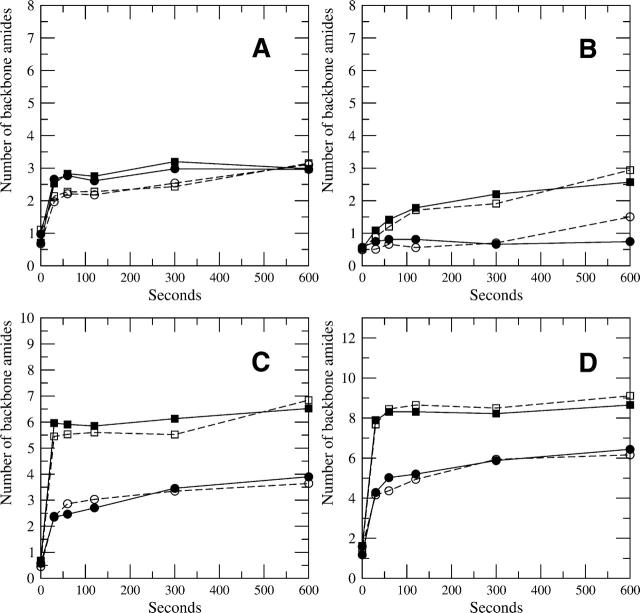
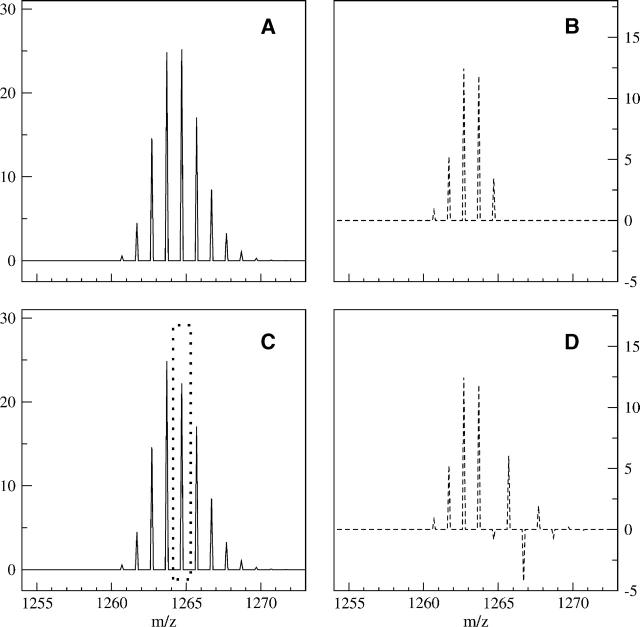
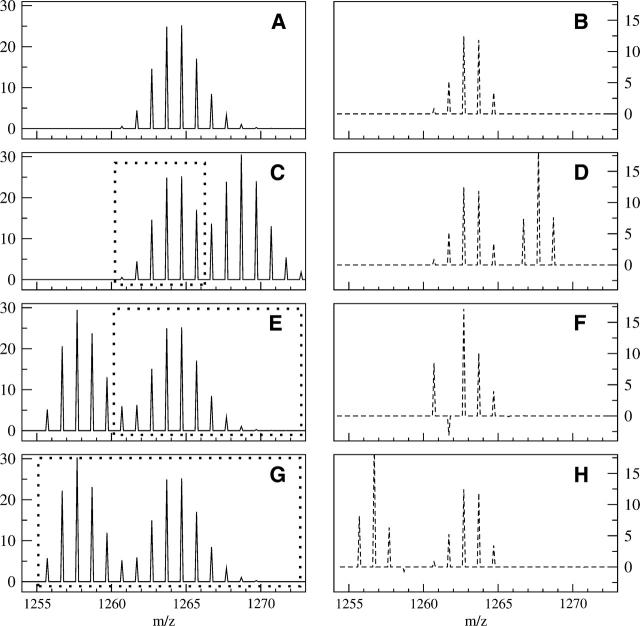
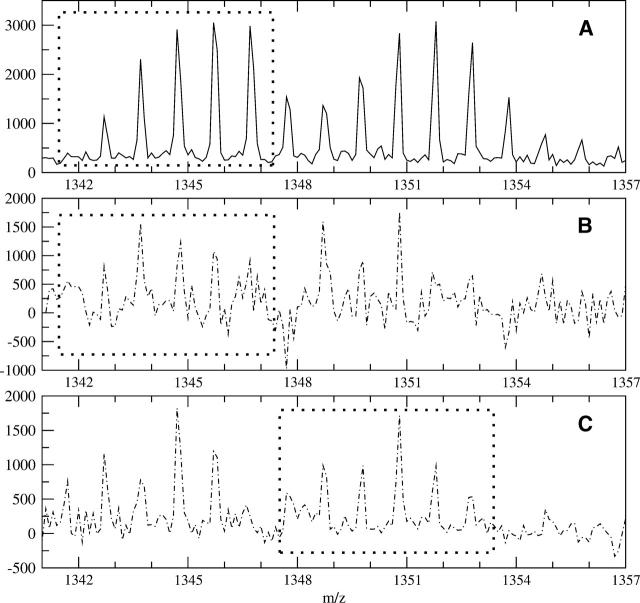
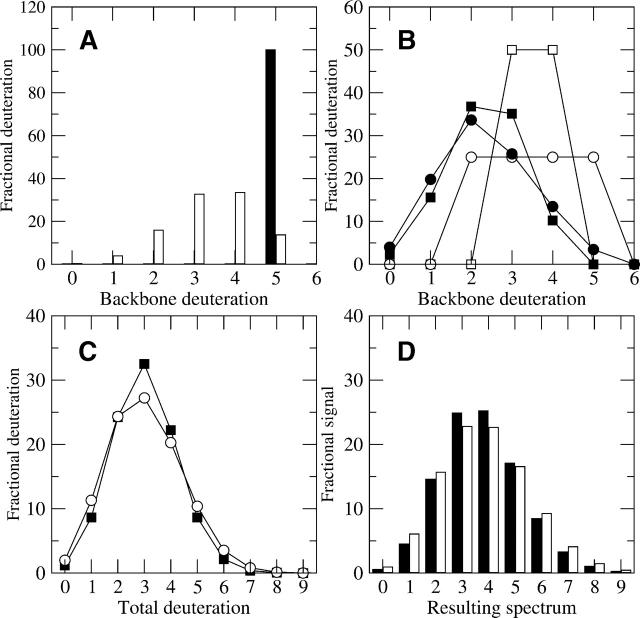
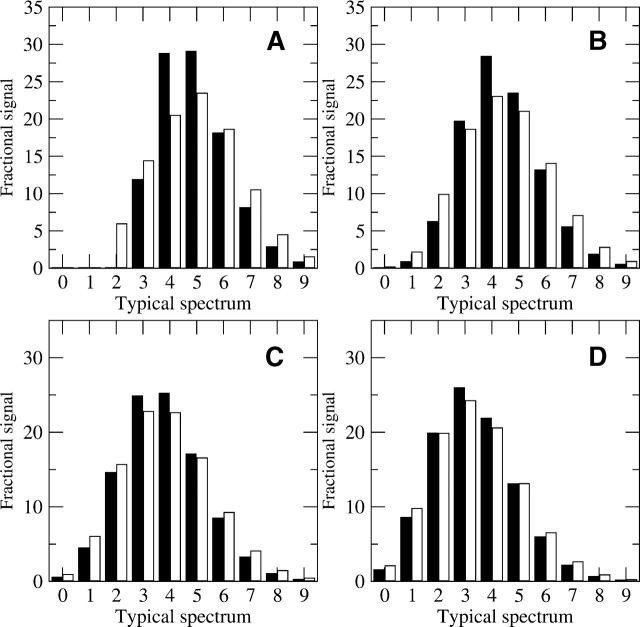
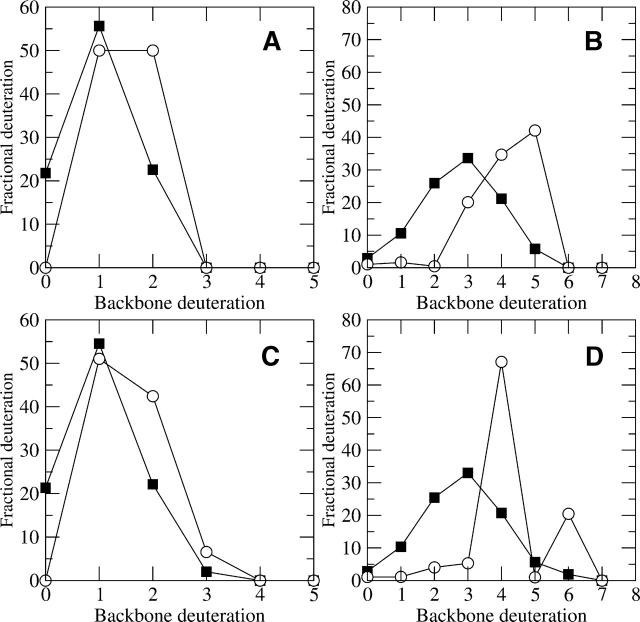
A Fourier deconvolution method has been developed to explicitly determine the amount of backbone amide deuterium incorporated into protein regions or segments by hydrogen/deuterium (H/D) exchange with high-resolution mass spectrometry. Determination and analysis of the level and number of backbone amide exchanging in solution provide more information about the solvent accessibility of the protein than do previous centroid methods, which only calculate the average deuterons exchanged. After exchange, a protein is digested into peptides as a way of determining the exchange within a local area of the protein. The mass of a peptide upon deuteration is a sum of the natural isotope abundance, fast exchanging side-chain hydrogens (present in MALDI-TOF H/2H data) and backbone amide exchange. Removal of the components of the isotopic distribution due to the natural isotope abundances and the fast exchanging side-chains allows for a precise quantification of the levels of backbone amide exchange, as is shown by an example from protein kinase A. The deconvoluted results are affected by overlapping peptides or inconsistent mass envelopes, and evaluation procedures for these cases are discussed. Finally, a method for determining the back exchange corrected populations is presented, and its effect on the data is discussed under various circumstances.


Figures

Figure 1.
Figure 1.
(A) A theoretical natural isotope profile for the peptide with sequence IYRDLKPENL (residues 163–172) of C-subunit of PKA, using the standard natural abundances of each elements’ isotopes (sample spacing was 0.100 mass units). (B) An observed nondeuterated MALDI-TOF mass envelope for sequence IYRDLKPENL (residues 163–172). (C) The dashed line represents the result of profile B after deconvolution with A and reveals the only significant peak is at the monoisotopic weight of m/z = 1260.70 (using a 0.100 mass unit sample interval). This indicates the observed mass spectrum corresponds closely with the theoretical natural isotope and no extra deuteration exists.
Figure 2.
Figure 2.
(A) The theoretical distribution of fast exchanging side-chain and termini hydrogens for sequence IYRDLKPENL (residues 163–172). According to Table 1, there are 15 fast exchanging hydrogens for this sequence, and the final deuterium in solution was 4.5%. (B) The observed deuteration profile of the same peptide in the quench conditions only. The natural isotopic profile has already been removed by deconvolution, revealing the total level of deuteration present in this spectrum. (C) The deconvolution of B with A reveals the deuteration due solely to backbone amide exchange. In this case, there is no backbone amide on-exchange, which is consistent with quench conditions.
Figure 3.
Figure 3.
(A–D) Trials of four different peptides deuterated in only the quench solution from the C-subunit of PKA and their comparison with the theoretical fast exchanging profiles (dashed lines and square symbols). The sequences are as follows: (A) KRILQAVNF (m/z(0) = 1088.658), residues 92–100; (B) SKGYNKAVDW (m/z(0) = 1167.580), residues 212–221; (C) DRIKTLGTGSF (m/z(0) = 1194.648), residues 44–54; and (D) IYRDLKPENL (m/z(0) = 1260.695), residues 163–172, respectively. The signal-to-noise ratios for A–D are 77, 48, 191, and 150, respectively. The higher signal-to-noise ratios had higher correlation with the theoretical profile, but all sequences showed general agreement. The three outlying trials in B may be due to deamination of asparagines.
Figure 4.
Figure 4.
(A) An observed MALDI-TOF mass envelope for sequence IYRDLKPENL, deuterated for 120 sec under experimental conditions. (B) The deconvoluted result of the theoretical natural isotopic profile (Fig. 1A) with the spectrum in A. The signal corresponds to the weights of deuterium incorporation, which is a combination of fast exchanging side-chain hydrogen exchange and backbone amide hydrogen exchange. (C) Deconvoluting the total deuteration profile (B) with the theoretical fast exchange profile (Fig. 2A) results in the deuteration due solely to the backbone amide exchange. This figure clearly shows significant populations of peptides with zero and one backbone amides exchanging, while the small M(2) peak is inconclusive. Nonetheless, it is shown that there are not two equally exchanging backbone amide sites at this time point. (D) A theoretical mass envelope reconstructed by using only the following information: one backbone amide exchanging at 49%, 15 fast exchanging side-chains at 4.5%, and the natural isotope profile for sequence IYRDLKPENL. A comparison of D with A illustrates how well the three parts of the model explain the entire observed mass envelope. The high correlation coefficient of 0.9953 between the two values’ mass envelopes indicates complete extraction of the important components of the original mass envelope.
Figure 5.
Figure 5.
(A–D) A centroid comparison of backbone deuteration by two methods using four peptides for the C-subunit of PKA. One method calculates the centroids from the mass envelope and subtracts the control centroid to reveal the level of backbone deuteration (open squares and circles represent the free and complex backbone deuteration levels, respectively). The other method calculates the centroids by using the backbone deuteration peaks after deconvolution (filled squares and circles for the free and complex backbone deuteration levels, respectively). The sequences are as follows: (A) KRILQAVNF (m/z(0)= 1088.658), residues 92–100; (B) IYRDLKPENL (m/z(0)= 1260.695), residues 163–172; (C) DRIKTLGTGSF (m/z(0) = 1194.648), residues 44–54; and (D) DQFDRIKTLGTGSF (m/z(0) = 1584.802), residues 41–54, respectively. The general agreement among all peptides shows the consistency between the two methods.
Figure 6.
Figure 6.
(A) An ideal, simulated mass envelope for sequence IYRDLKPENL using 4.5% HOD. (B) The result of deconvolution of A with both the natural isotopic and fast exchanging profiles reveals the backbone amide deuteration profile, which has up to four backbone amides exchanging. (C) Inconsistent intraprofile signals (shown by the dashed box in C) in mass envelopes also cause problems for deconvolution methods. The mass envelope has an M(4) signal that is only 22% of the total signal (C), compared with the original level of 25% (A). (D) The effects of the inconsistent signals are replicated downstream due to a mismatch between the model and the mass envelope, causing difficulty in analyzing the backbone amide populations explicitly, but the centroid calculation is fairly robust in this situation, even when applied to the deconvoluted profiles.
Figure 7.
Figure 7.
Examples of separating a desired mass envelope from two overlapping spectra. (A, B) The same ideal, simulated mass spectrum and deconvoluted result as in Figure 6, A and B. (C) A theoretical mass spectrum in which a peptide with a monoisotopic mass of 1266.70 overlaps the original peptide shown in A, causing an end overlap. The dashed box in C represents the portion of the original spectrum that is uncontaminated signal from sequence IYRDLKPENL. (D) The resulting backbone deuteration distribution after deconvolution of the natural abundance and side-chain profiles present in spectrum B. A comparison between D and B shows the complete extraction of the first mass envelope’s backbone amide deuteration profile. (E) Another theoretical spectrum in which a peptide with a monoisotopic mass of 1255.70 overlaps the original peptide, causing a front overlap for the desired mass envelope. (F) Attempting to deconvolute the mass envelope with the original range of 1260.70 to 1272.70 (dashed box in E) causes problems. The extra signal in the M(0), M(1) portion of the mass envelope is contained in the model spectrum, resulting in negative weights that are physically unrealistic. (G) The same spectrum as in E, but the theoretical profile (dashed box) has been shifted to start at the front of the first overlapping envelope. (H) The result of deconvolution of the mass envelope in G over the larger interval. The change in the deconvolution starting point allowed the calculation to separate the signal due to the other peptide and reveal the backbone amide populations for the peptide of interest.
Figure 8.
Figure 8.
Analysis of overlapping profiles using real data. (A) An overlapping spectra containing peptide FDRIKTLGTGSF (sequence 43–54) and peptide TKRFGNLKNGVN (sequence 278–289) of the C-subunit of PKA after 30 sec of deuteration. The two peptides have similar monoisotopic masses, 1341.7117 and 1347.7497, respectively, and overlap enough to cause analysis problems using only centroids. The dashed box shows the portion of the spectrum due solely to residues 43–54. (B) By using the theoretical profile for peptide FDRIKTLGTGSF, the deconvoluted signal between 1342.3 and 1347.3 is due solely to peptide FDRIKTLGTGSF, indicating up to five backbone amides exchanging (peaks within the dashed box). The sixth site is negative, showing a mismatch where the contamination with the heavier peptide begins. (C) Using the heavier peptide’s theoretical profile shifted over to the start of the first peptide produces a clean deconvolution for the peptide TKRF GNLKNGVN (peaks inside the dashed box). The second peptide also shows up to five backbone amides exchanging under experimental conditions.
Figure 9.
Figure 9.
(A) A sample deuteration profile of sequence IYRDLKPENL before and after the back exchange during quench (assumes 33% back exchange). The black bar represents a profile where 100% of the peptide fragments have added five deuterons before back exchange. During quench, 33% of the deuterons are lost in a binomial process, with the resulting profile after represented by the white bars. (B) Two sample backbone amide exchange profiles of sequence IYRDLKPENL under two different experimental conditions are shown before (open symbols) and after (filled symbols) 33% back exchange. The original backbone profiles are quite different, but the back exchange smoothes the differences and makes the two trials look less distinguishable from each other (filled symbols). (C) The addition of the fast exchanging deuterationprofile causes additional broadening and smoothing of both trials, where filled squares and circles of B represent filled squares and open circles in C, respectively. (D) The final addition of the natural isotopic profiles to the total deuteration profile of C creates the simulated observable mass envelopes. Despite having significantly different backbone amide profiles, and thus significantly different exposure to the solvent, the two observable mass envelopes are quite similar and difficult to distinguish from one another.
Figure 10.
Figure 10.
(AD) Examples of the difference between the mass envelopes for the two experimental conditions of sequence IYRDLKPENL (Fig. 9B) under different levels of back exchange. The back exchange level of each example for parts AD is 0%, 15%, 33%, and 45%, respectively. As the back exchange level increases, the smoothing also increases, which minimizes differences between the two samples. In this case, the 0% level exhibits several important differences, while the 15% level retains some of those differences. By 33% back exchange, the differences are becoming obscure, and they are quite small by 45% back exchange. With 45% back exchange, the level of discrimination necessary to distinguish the two mass envelopes is only reached by high-resolution data. Simple inspection of the envelopes will not reveal the important differences between the two spectra in D, but removal of the natural isotopic and side-chain profiles to reveal the backbone deuteration profile will identify the differences between the two envelopes (as shown by the filled symbols in Figure 9B).
Figure 11.
Figure 11.
The effect of variation between trials on the resulting back exchange interpretations. (AD) The filled squares represent simulated backbone amide exchange profiles (before back correction), while the open circles represent the back exchange–corrected results. Samples with low (A) and high (B) levels of backbone amide exchange are compared to alternate trials of each. (C) Another simulated trial of the same peptide as in A has a small signal at M(3). The resulting back exchange corrected profile (open circles) is similar between the two trials. (D) Another trial of the same peptide as in B with a small signal at M(6) has a very different back exchange corrected profile (open circles) from the previous one (B). The large differences in the two complicate interpretations of this peptide and suggest high confidence in the data is necessary in order to distinguish between small (but real) peaks and background noise.

Similar articles

Cited by

References

    1. Anand, G.S., Hughes, C.A., Jones, J.M., Taylor, S.S., and Komives, E.A. 2002. Amide H/2H exchange reveals communication between the cAMP and catalytic subunit-binding sites in the RIαsubunit of protein kinase A. J. Mol. Biol. 323: 377–386. - PubMed
    1. Anand, G.S., Law, D., Mandell, J.G., Snead, A.N., Tsigelny, I., Taylor S.S., Ten Eyck, L.F., and Komives, E.A. 2003. Identification of the protein kinase A regulatory RIα-catalytic subunit interface by amide H/2H exchange and protein docking. Proc. Natl. Acad. Sci. 100: 13264–13269. - PMC - PubMed
    1. Clauser, K.R., Baker, P., and Burlingame, A.L. 1999. Role of accurate mass measurement (± 10 ppm) in protein identification strategies employing MS or MS/MS and database searching. Anal. Chem. 71: 2871–2882. - PubMed
    1. Dempsey, C.E. 2001. Hydrogen exchange in peptides and proteins using NMR spectroscopy. Progr. Nuclear Magn. Reson. Spectr. 39: 135–170.
    1. Englander, S. 1993. In pursuit of protein folding. Science 262: 848–849. - PMC - PubMed

Publication types

MeSH terms

LinkOut - more resources