. 2006 Mar;12(3):354-60.
doi: 10.1038/nm1368. Epub 2006 Feb 26.

Viral nanoparticles as tools for intravital vascular imaging

Affiliations

Viral nanoparticles as tools for intravital vascular imaging

John D Lewis et al. Nat Med. 2006 Mar.

Abstract

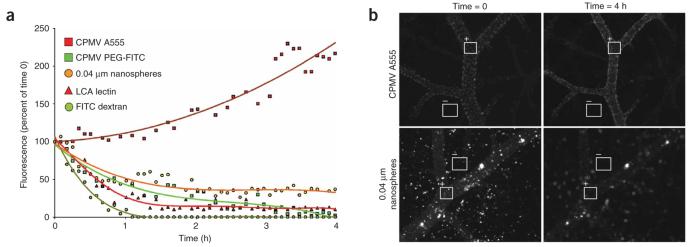
A significant impediment to the widespread use of noninvasive in vivo vascular imaging techniques is the current lack of suitable intravital imaging probes. We describe here a new strategy to use viral nanoparticles as a platform for the multivalent display of fluorescent dyes to image tissues deep inside living organisms. The bioavailable cowpea mosaic virus (CPMV) can be fluorescently labeled to high densities with no measurable quenching, resulting in exceptionally bright particles with in vivo dispersion properties that allow high-resolution intravital imaging of vascular endothelium for periods of at least 72 h. We show that CPMV nanoparticles can be used to visualize the vasculature and blood flow in living mouse and chick embryos to a depth of up to 500 microm. Furthermore, we show that the intravital visualization of human fibrosarcoma-mediated tumor angiogenesis using fluorescent CPMV provides a means to identify arterial and venous vessels and to monitor the neovascularization of the tumor microenvironment.


Figures

Figure 1
Figure 1
Labeling of CPMV particles with fluorescent dyes. (a) Subunit organization of CPMV: domain A (blue) represents the small subunit, domains B (orange) and C (yellow) represent the two domains of the large subunit. The maximum (31 nm) and minimum (25 nm) particle diameters according to the refined crystal structure are indicated. (b) Surface model of CPMV particle showing predicted arrangement of conjugated fluorochromes. (c) Size-exclusion FPLC analysis of CPMV-A555 conjugate. (d) SDS-PAGE analysis of CPMV-A555 (A555) and CPMV-PEG-FITC (PF) conjugates. Mobility of unmodified large (L, 42 kDa) and small (S, 24 kDa) virus subunits are indicated. The marker (M) is Bio-Rad broad-range prestained standard. Both panels are the same gel, Coomassie Blue staining (left) and ultraviolet illumination (right) to detect conjugated fluorescent dye. Unmodified subunits are visible with Coomassie staining but not under ultraviolet light (marked S, L). In PF lane, L1, L2 and L3 correspond to the conjugation of 1, 2 and 3 PEG molecules to the large subunit. S1 and S2 represent conjugation of 1 or 2 PEG molecules to the small subunit. (e) Fluorescence quantification per molecule expressed as a ratio of a single fluorescein dextran molecule. Average labeling of CPMV particles is indicated. Fd, 10 kDa fluorescein dextran; A4d, 10 kDa Alexa Fluor 488 dextran; Rhl, rhodamine-labeled L. culinaris lectin; CPMV PF, CPMV PEG-FITC. ‘0,04 μm nanospheres’ are FluoSpheres carboxylate-modified orange fluorescent microspheres, 0.04 μm.
Figure 2
Figure 2
Fluorescent dye–conjugated CPMV particles enable visualization of vasculature intravitally and in fixed tissues. (a) Fluorescence images of tissue cryosections from kidney (asterisk indicates vessel lumen), heart, placenta and liver isolated from adult mice coinjected with CPMV-A555 (top panels) and fluorescein dextran (bottom panels). Scale bar, 50 μm. (b,c) Intravital imaging of CPMV-A555 perfused 11.5-d embryo with the yolk sac intact (b) and removed (c). White boxes indicate the regions magnified in (e) and (f). Scale bar, 1.1 mm. Images were captured approximately 1 h after injection. (d) Cryosection of an 11.5-d mouse embryo perfused with CPMV-A555. White box indicates the region magnified in (g). Scale bar, 1.1 mm. (e) Yolk sac vasculature, magnified. Scale bar, 25 μm. (f) Capillaries in the head region. Scale bar, 25 μm. (g) Intersomitic and placental vessels in embryo tissue section. Scale bar, 100 μm. (h–o) Comparison of intravital imaging with CPMV-A555 (h–k) and fluorescent nanospheres (e–o) in E11.5 mouse embryo. (h,l) Whole embryo. Scale bar, 1.1 mm. (i,m) Head region, arrows indicate areas of differential staining of anterior vasculature, brain vasculature. Scale bar, 770 μm. (j,n) CPMV staining allows increased resolution of intersomitic vessels. Scale bar, 540 μm. (k,o) Arrows indicate capillary and larger vessels of yolk sac membrane. Scale bar, 50 μm.
Figure 3
Figure 3
Intravital fluorescence imaging of chick CAM vasculature and subcellular localization of CPMV. (a) Fluorescence image looking down through surface of chick CAM showing multiple levels of vasculature, through capillary bed and larger vessels below to arterioles and venules. Scale bar, 100 μm. (b) CAM arteriole. Scale bar, 22 μm. (c) CAM venule (arrows in b and c denote blood flow direction). Scale bar, 22 μm. (d) Intravital image of large CAM vein, CPMV-A555 (orange), endothelial cell nuclei (blue) stained with Hoechst 33258. Box indicates area magnified in e. Scale bar, 16 μm. (e) CPMV particles are restricted to perinuclear compartments in the vascular endothelial cells. Compartments show uniform cell polarity. Scale bar, 5.5 μm. (f,g) CPMV-A555 remains restricted to endothelial cells and allows intravital staining of the vasculature over long periods of time. 72 h after the initial injection of CPMV-A555, venular staining remains roughly equivalent to the initial staining. Scale bar, 160 μm. (h) Transmission electron micrograph of chick embryo CAM injected with CPMV-A555 showing CPMV particles being actively internalized into an endothelial cell (black arrows indicate CPMV particles). ec, endothelial cell; n, nucleus. Asterisk indicates vessel lumen. Scale bar, 100 nm. (i) Endothelial cell with CPMV-filled vesicle. Arrows indicate CPMV particles among many. Scale bar, 64 nm. (j) Macrophage (wbc) at the luminal periphery with large CPMV-containing vesicles (arrows). rbc, red blood cell. Scale bar, 693 nm.
Figure 4
Figure 4
Comparison of intravital vascular staining intensity over time in the chick embryo. (a) Comparative analysis of changes in vascular staining intensity over time in the chick embryo using CPMV-A555, CPMV-PEG-FITC, 0.04 μm nanospheres, LCA lectin and FITC dextran. Reagent amounts were adjusted to equivalent total fluorescence. A single frame was captured every 5 min for a 4-h period. Regions of interest (ROI) within the vasculature were sampled at each time point for average fluorescence intensity, background values were subtracted, and the resultant values were graphed against initial fluorescence intensity. (b) Representative images captured immediately after injection (time = 0) and 4 h after injection (time = 4 h) showing sampled ROI during intravital retained fluorescence assay. Fluorescence average of negative ROI (−) was subtracted from positive ROI (+).
Figure 5
Figure 5
Evaluation of tumor angiogenesis in an intravital CAM/HT1080 fibrosarcoma model. (a) Bright-field image of HT1080 tumor CAM onplant at 7 d. Opaque object is a nylon mesh grid used for quantification of angiogenesis. (b) Fluorescence image of tumor onplant after injection of embryo with 50 μg of CPMV-A555. (c) High-magnification (×20) image of tumor interior shown in b; tumor microvasculature is clearly visualized. (d,e) Visualization of HT1080 tumor angiogenesis using CPMV-A555. (d) Left, visualization of preexisting vasculature in the CAM immediately after HT1080 tumor cell injection using CPMV-A555. Middle, GFP-expressing HT1080 tumor bolus under the surface of CAM. Right, merge. Scale bar, 100 μm. (e) Left, visualization of preexisting CAM vasculature and neovasculature arising from tumor angiogenesis 24 h after tumor-cell injection. Middle, GFP-expressing HT1080 tumor bolus. The extensive migration over 24 h indicates a high level of tumor-cell viability. Right, merge. Scale bar, 100 μm. (f) Intravital vascular mapping of tumor angiogenesis using CPMV-A555 and CPMV-A488. Human fibrosarcoma HT1080 tumor cells were implanted within CAM. After 48 h of incubation, embryos were injected with 50 μg of CPMV-A555 (left panels). After a further 24-h incubation, embryos were injected with 50 μg of CPMV-A488 (right panels) and visualized. Arrows indicate a site of angiogenic sprouting and arrowheads indicate newly formed vessels.

Similar articles

Cited by

References

    1. McDonald DM, Choyke PL. Imaging of angiogenesis: from microscope to clinic. Nat. Med. 2003;9:713–725. - PubMed
    1. Yang CS, et al. Nanoparticle-based in vivo investigation on blood-brain barrier permeability following ischemia and reperfusion. Anal. Chem. 2004;76:4465–4471. - PubMed
    1. Josephson L, Kircher MF, Mahmood U, Tang Y, Weissleder R. Near-infrared fluorescent nanoparticles as combined MR/optical imaging probes. Bioconjug. Chem. 2002;13:554–560. - PubMed
    1. Lee PJ, Peyman GA. Visualization of the retinal and choroidal microvasculature by fluorescent liposomes. Methods Enzymol. 2003;373:214–233. - PubMed
    1. Rizzo V, Steinfeld R, Kyriakides C, DeFouw DO. The microvascular unit of the 6-day chick chorioallantoic membrane: a fluorescent confocal microscopic and ultrastructural morphometric analysis of endothelial permselectivity. Microvasc. Res. 1993;46:320–332. - PubMed

Publication types

MeSH terms