

Quantifying effects of plaque structure and material properties on stress distributions in human atherosclerotic plaques using 3D FSI models
- PMID: 16502661
- PMCID: PMC1474006
- DOI: 10.1115/1.2073668
Quantifying effects of plaque structure and material properties on stress distributions in human atherosclerotic plaques using 3D FSI models
Abstract
Background: Atherosclerotic plaques may rupture without warning and cause acute cardiovascular syndromes such as heart attack and stroke. Methods to assess plaque vulnerability noninvasively and predict possible plaque rupture are urgently needed.
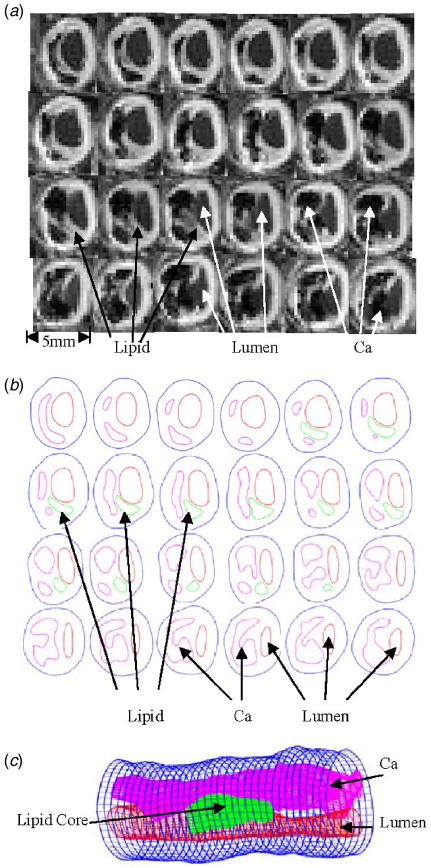
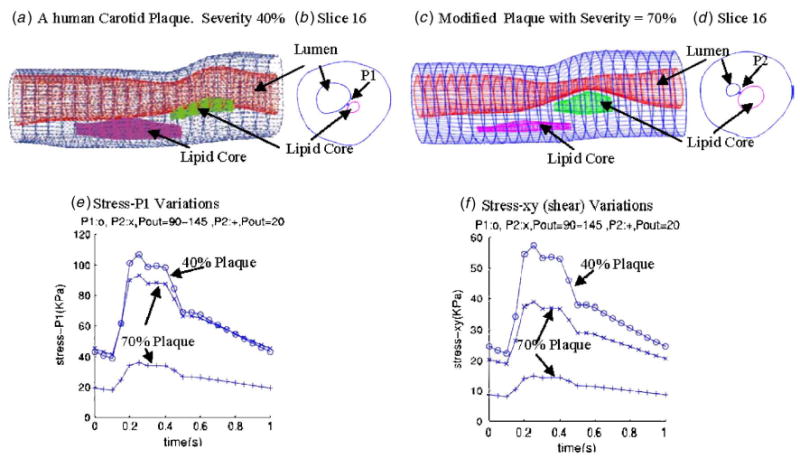
Method: MRI-based three-dimensional unsteady models for human atherosclerotic plaques with multi-component plaque structure and fluid-structure interactions are introduced to perform mechanical analysis for human atherosclerotic plaques.
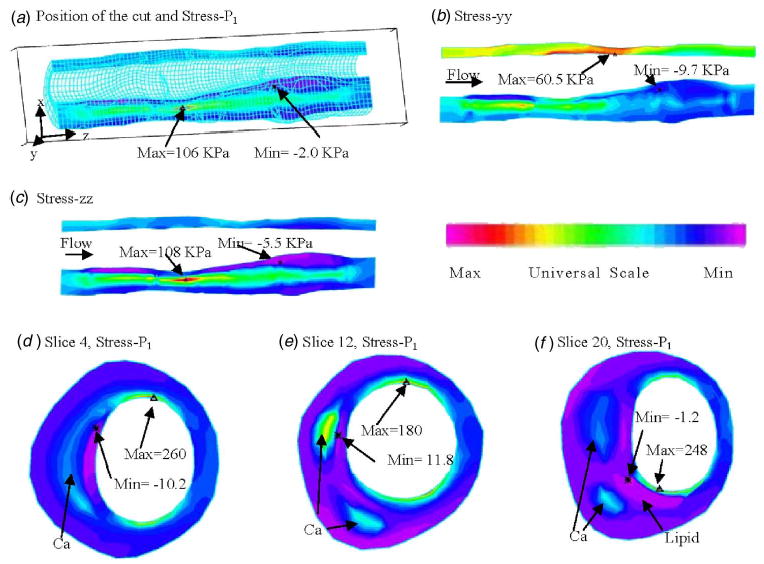
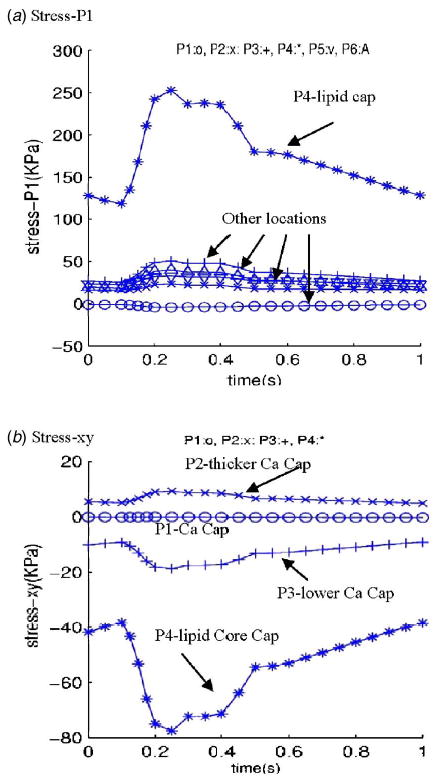
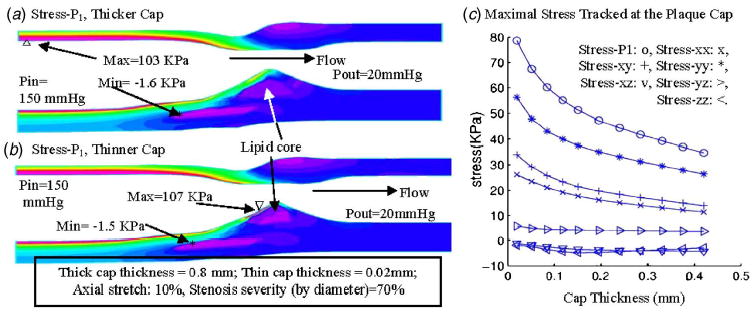
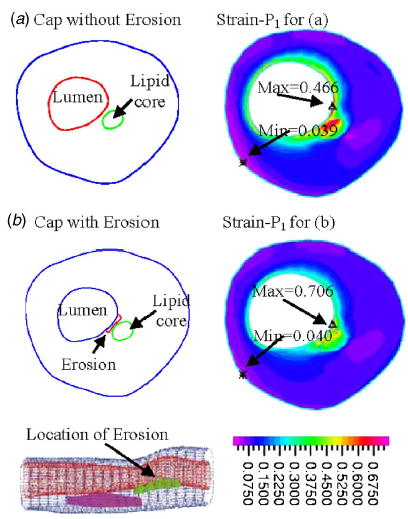
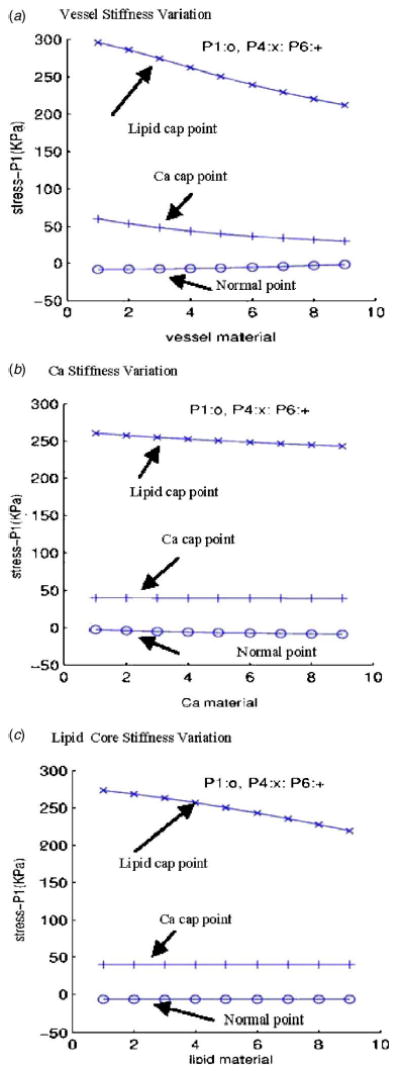
Results: Stress variations on critical sites such as a thin cap in the plaque can be 300% higher than that at other normal sites. Large calcification block considerably changes stress/strain distributions. Stiffness variations of plaque components (50% reduction or 100% increase) may affect maximal stress values by 20-50%. Plaque cap erosion causes almost no change on maximal stress level at the cap, but leads to 50% increase in maximal strain value.
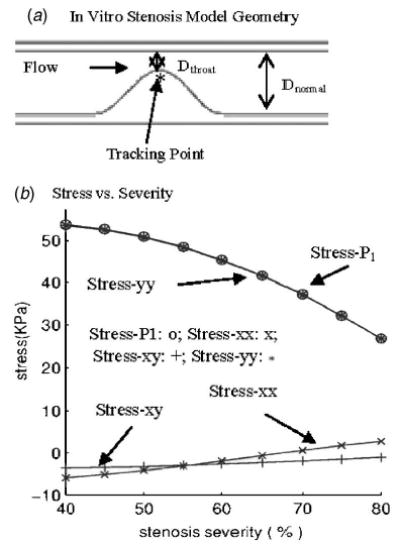
Conclusions: Effects caused by atherosclerotic plaque structure, cap thickness and erosion, material properties, and pulsating pressure conditions on stress/strain distributions in the plaque are quantified by extensive computational case studies and parameter evaluations. Computational mechanical analysis has good potential to improve accuracy of plaque vulnerability assessment.
Figures
Similar articles
-
Mechanics of Atherosclerotic Plaques: Effect of Heart Rate.Cardiovasc Eng Technol. 2019 Jun;10(2):344-353. doi: 10.1007/s13239-019-00413-6. Epub 2019 Apr 4. Cardiovasc Eng Technol. 2019. PMID: 30949919
-
3D MRI-based anisotropic FSI models with cyclic bending for human coronary atherosclerotic plaque mechanical analysis.J Biomech Eng. 2009 Jun;131(6):061010. doi: 10.1115/1.3127253. J Biomech Eng. 2009. PMID: 19449964 Free PMC article.
-
3D MRI-based multicomponent FSI models for atherosclerotic plaques.Ann Biomed Eng. 2004 Jul;32(7):947-60. doi: 10.1023/b:abme.0000032457.10191.e0. Ann Biomed Eng. 2004. PMID: 15298432
-
Local elasticity imaging of vulnerable atherosclerotic coronary plaques.Adv Cardiol. 2007;44:35-61. doi: 10.1159/000096719. Adv Cardiol. 2007. PMID: 17075198 Review.
-
Intravascular palpography for high-risk vulnerable plaque assessment.Herz. 2003 Sep;28(6):488-95. doi: 10.1007/s00059-003-2488-6. Herz. 2003. PMID: 14569389 Review.
Cited by
-
Artery buckling affects the mechanical stress in atherosclerotic plaques.Biomed Eng Online. 2015;14 Suppl 1(Suppl 1):S4. doi: 10.1186/1475-925X-14-S1-S4. Epub 2015 Jan 9. Biomed Eng Online. 2015. PMID: 25603490 Free PMC article.
-
Calculation of arterial wall temperature in atherosclerotic arteries: effect of pulsatile flow, arterial geometry, and plaque structure.Biomed Eng Online. 2007 Mar 1;6:8. doi: 10.1186/1475-925X-6-8. Biomed Eng Online. 2007. PMID: 17331253 Free PMC article.
-
An inverse method for mechanical characterization of heterogeneous diseased arteries using intravascular imaging.Sci Rep. 2021 Nov 18;11(1):22540. doi: 10.1038/s41598-021-01874-3. Sci Rep. 2021. PMID: 34795350 Free PMC article.
-
Patient-Specific Numerical Simulations of Coronary Artery Hemodynamics and Biomechanics: A Pathway to Clinical Use.Cardiovasc Eng Technol. 2024 Oct;15(5):503-521. doi: 10.1007/s13239-024-00731-4. Epub 2024 May 6. Cardiovasc Eng Technol. 2024. PMID: 38710896 Review.
-
The effect of angulation in abdominal aortic aneurysms: fluid-structure interaction simulations of idealized geometries.Med Biol Eng Comput. 2010 Dec;48(12):1175-90. doi: 10.1007/s11517-010-0714-y. Epub 2010 Nov 19. Med Biol Eng Comput. 2010. PMID: 21088917
References
-
- American Heart Association, 2003, Heart Disease and Stroke Statistics–2003 Update Dallas, Tex. American Heart Association.
-
- Naghavi M, Libby P, Falk E, Casscells SW, Litovsky S, Rumberger J, Badimon JJ, Stefanadis C, Moreno P, Pasterkamp G, Fayad Z, Stone PH, Waxman S, Raggi P, Madjid M, Zarrabi A, Burke A, Yuan C, Fitzgerald PJ, Siscovick DS, de Korte CL, Aikawa M, Juhani Airaksinen KE, Assmann G, Becker CR, Chesebro JH, Farb A, Galis ZS, Jackson C, Jang IK, Koenig W, Lodder RA, March K, Demirovic J, Navab M, Priori SG, Rekhter MD, Bahr R, Grundy SM, Mehran R, Colombo A, Boerwinkle E, Ballantyne C, Insull W, Jr, Schwartz RS, Vogel R, Serruys PW, Hansson GK, Faxon DP, Kaul S, Drexler H, Greenland P, Muller JE, Virmani R, Ridker PM, Zipes DP, Shah PK, Willerson JT. “From Vulnerable Plaque to Vulnerable Patient: A Call for New Definitions and Risk Assessment Strategies: Part I,”. Circulation. 2003;108(14):1664–1672. - PubMed
-
- Naghavi, M., et al., (same as Ref. [2]), 2003, “From Vulnerable Plaque to Vulnerable Patient: A Call for New Definitions and Risk Assessment Strategies: Part II,” Circulation, 108(15), pp. 1772–1778. - PubMed
-
- The Vulnerable Atherosclerotic Plaque: Understanding, Identification, and Modification, V. Fuster, J. F. Cornhill, R. E. Dinsmore, J. T. Fallon, W. Insull, P. Libby, S. Nissen, M. E. Rosenfeld, and W. D. Wagner, eds., AHA Monograph series, 1998, Futura Publishing, Armonk, NY.
-
- Humphrey, J. D., 2002, Cardiovascular Solid Mechanics, Springer-Verlag, NY.
Publication types
MeSH terms
Grants and funding
LinkOut - more resources
Full Text Sources
Other Literature Sources
Medical
Miscellaneous
