. 2006 Mar 7;45(9):2820-35.
doi: 10.1021/bi050010i.

Modulation of reactivity and conformation within the T-quaternary state of human hemoglobin: the combined use of mutagenesis and sol-gel encapsulation

Affiliations

Modulation of reactivity and conformation within the T-quaternary state of human hemoglobin: the combined use of mutagenesis and sol-gel encapsulation

Uri Samuni et al. Biochemistry. .

Abstract

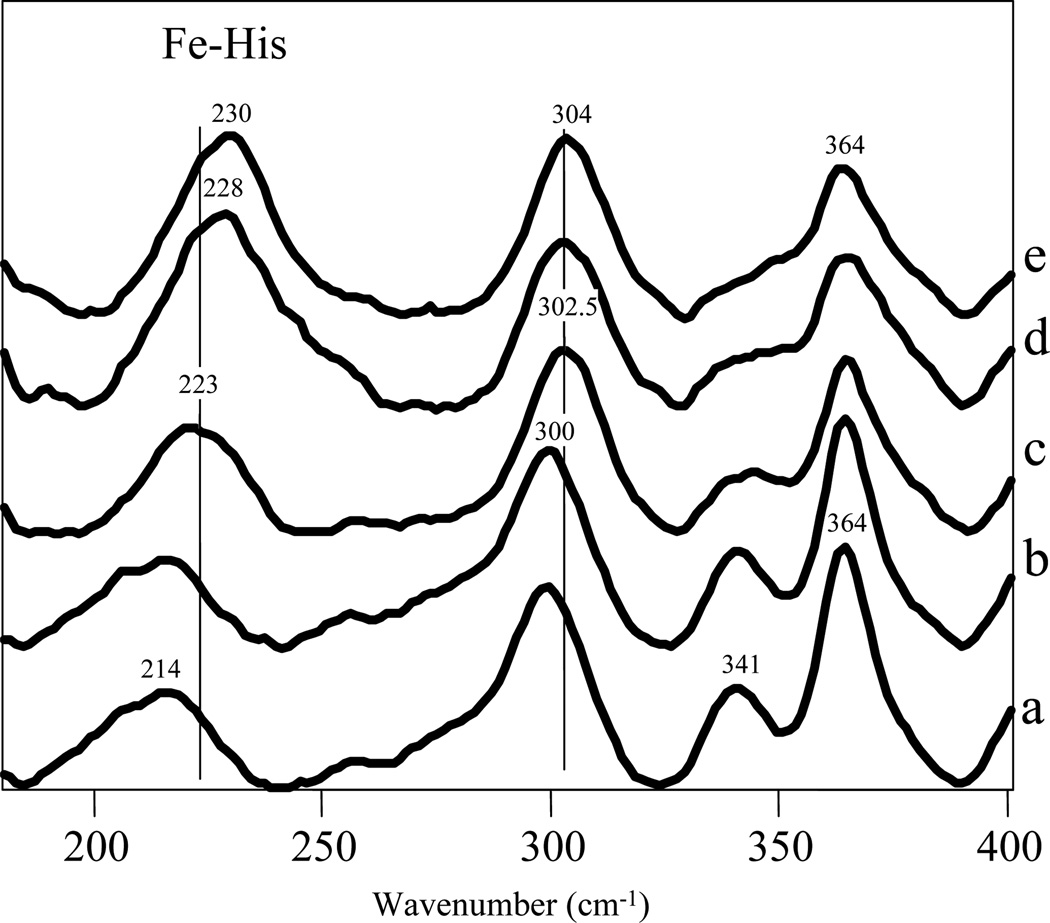
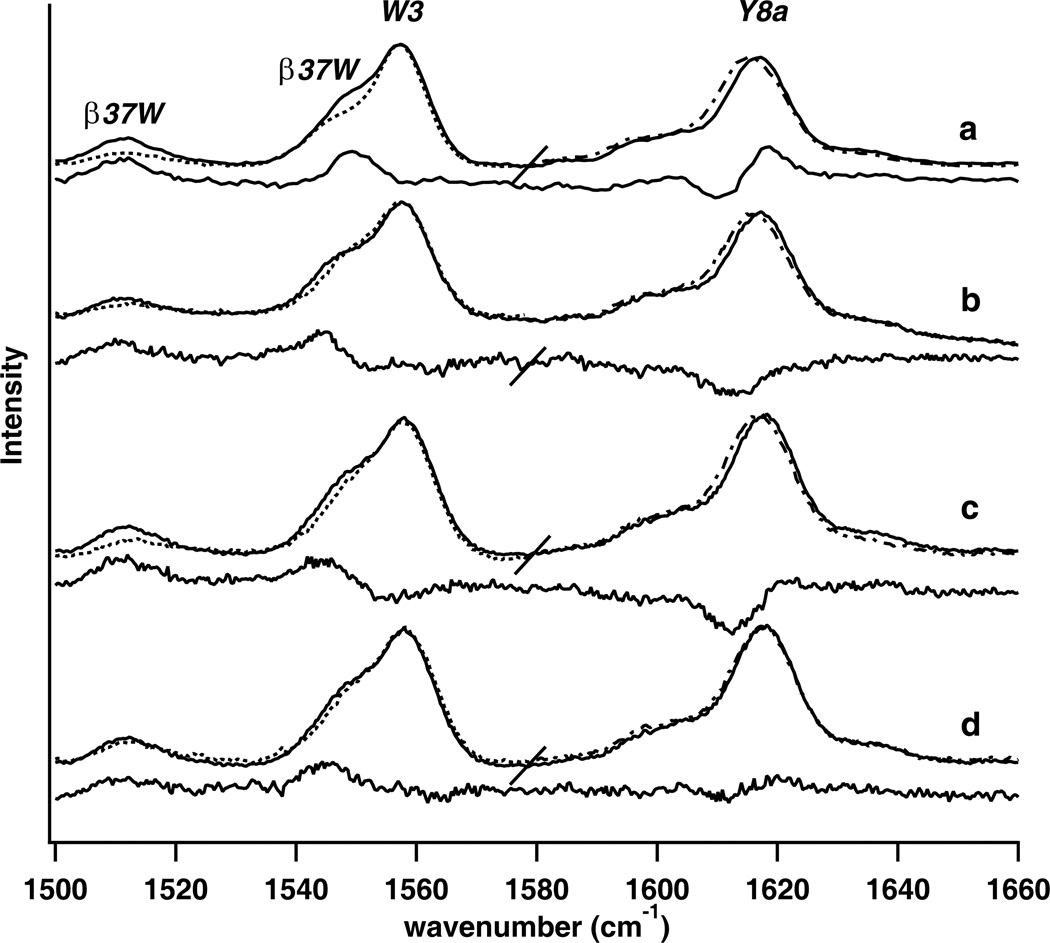
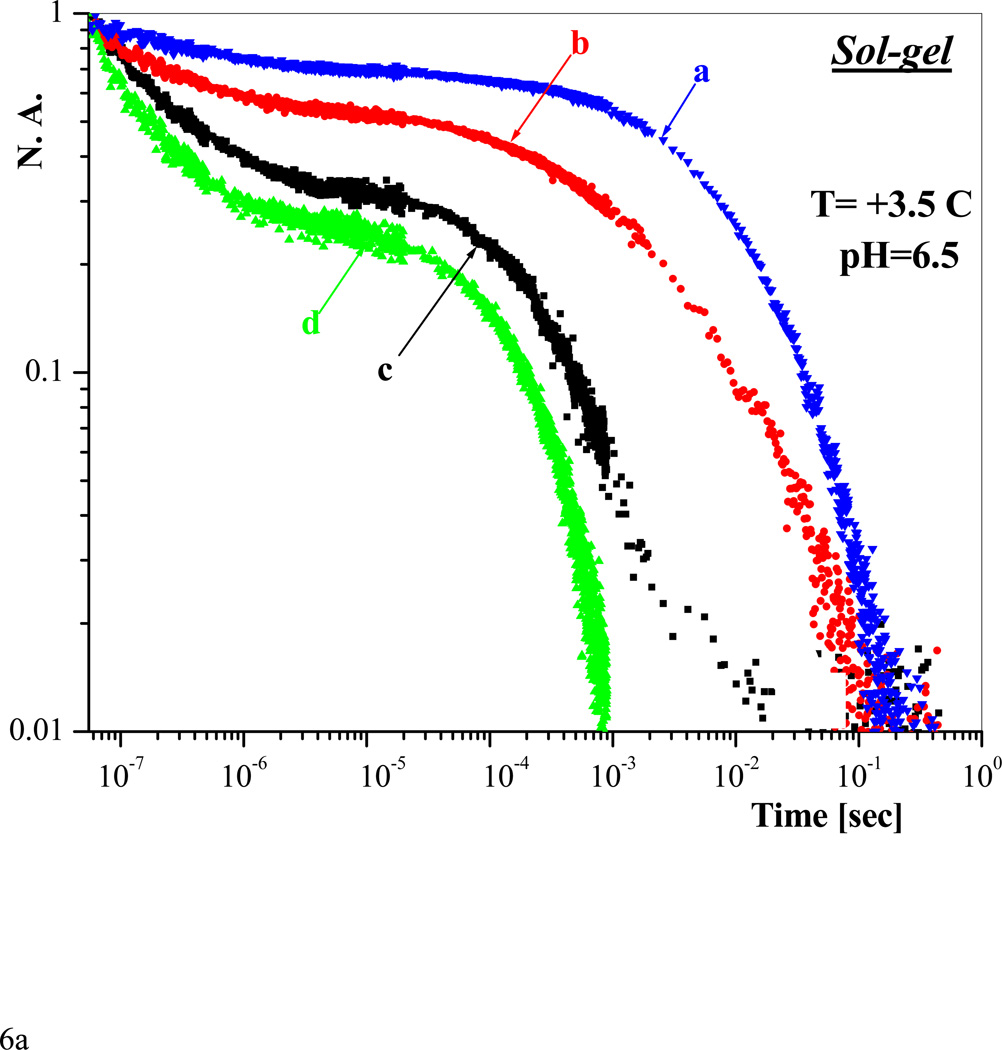
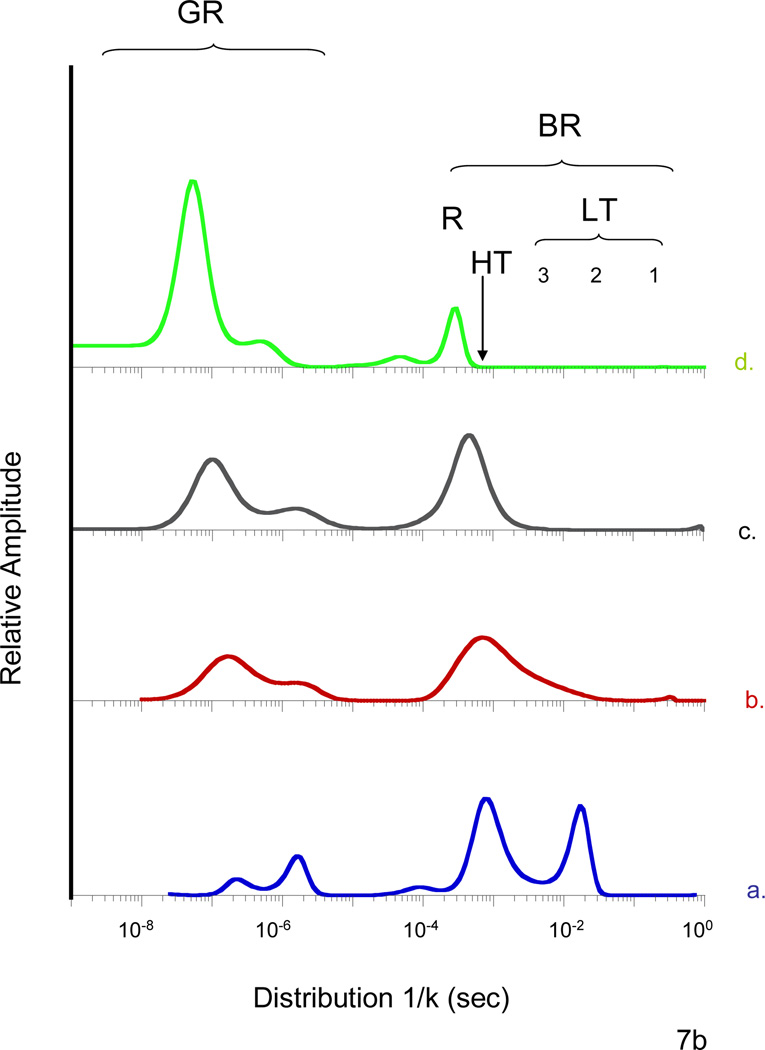
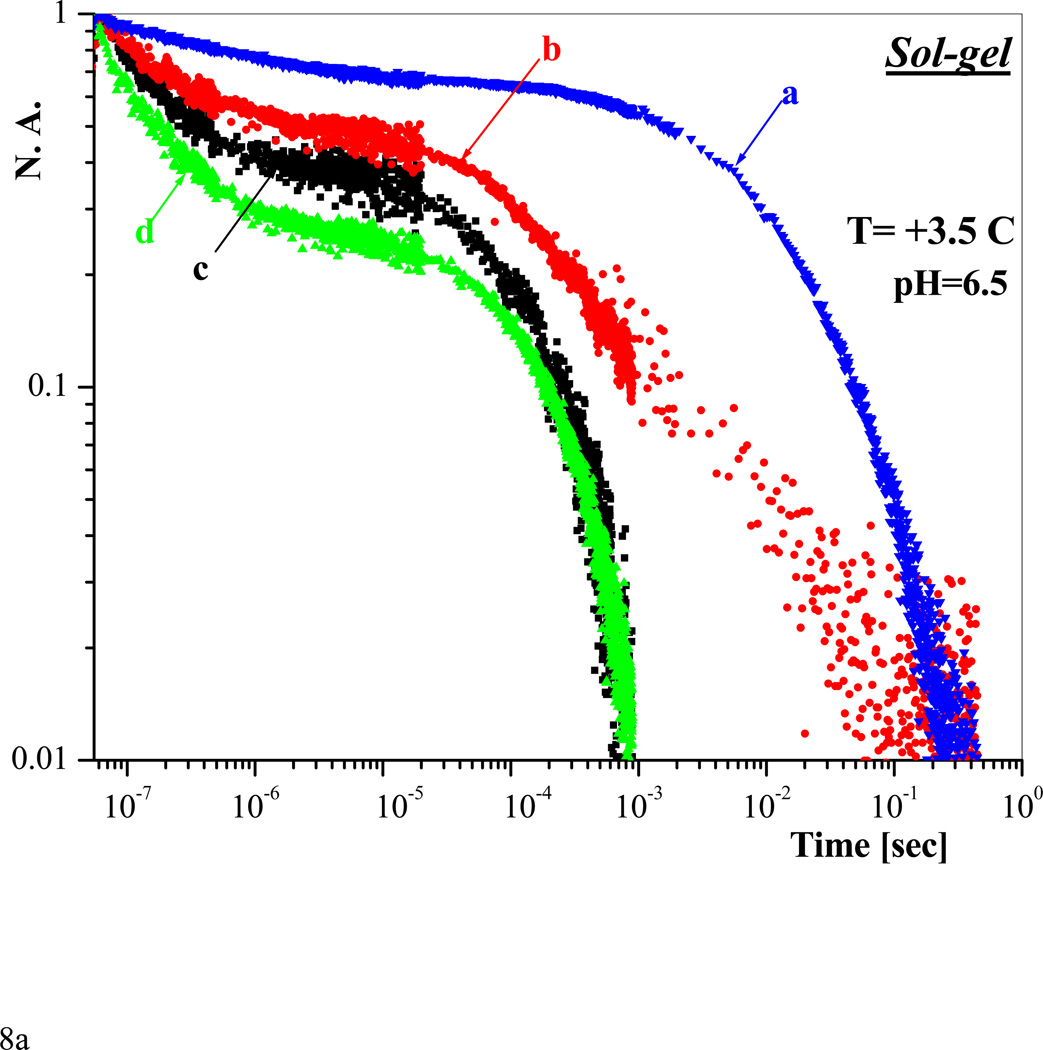
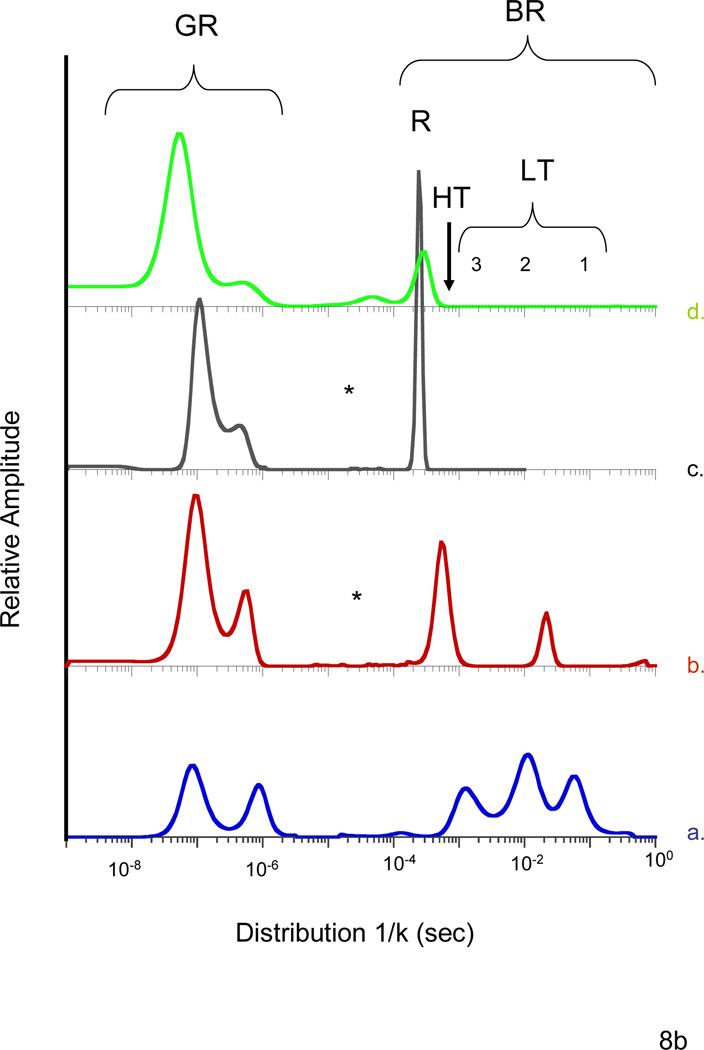
A range of conformationally distinct functional states within the T quaternary state of hemoglobin are accessed and probed using a combination of mutagenesis and sol-gel encapsulation that greatly slow or eliminate the T --> R transition. Visible and UV resonance Raman spectroscopy are used to probe the proximal strain at the heme and the status of the alpha(1)beta(2) interface, respectively, whereas CO geminate and bimolecular recombination traces in conjunction with MEM (maximum entropy method) analysis of kinetic populations are used to identify functionally distinct T-state populations. The mutants used in this study are Hb(Nbeta102A) and the alpha99-alpha99 cross-linked derivative of Hb(Wbeta37E). The former mutant, which binds oxygen noncooperatively with very low affinity, is used to access low-affinity ligated T-state conformations, whereas the latter mutant is used to access the high-affinity end of the distribution of T-state conformations. A pattern emerges within the T state in which ligand reactivity increases as both the proximal strain and the alpha(1)beta(2) interface interactions are progressively lessened after ligand binding to the deoxy T-state species. The ligation and effector-dependent interplay between the heme environment and the stability of the Trp beta37 cluster in the hinge region of the alpha(1)beta(2) interface appears to determine the distribution of the ligated T-state species generated upon ligand binding. A qualitative model is presented, suggesting that different T quaternary structures modulate the stability of different alphabeta dimer conformations within the tetramer.


Figures

Figure 1
Figure 1
The low frequency portion of the Soret enhanced resonance Raman spectrum derived from: a. deoxy HbA, b. deoxy Hb(Nβ102A) +IHP, c. 8 ns photoproduct of COHb(Nβ102A)+IHP, d. the 8 ns photoproduct of COHbA+IHP and e. the 8 ns photoproduct of COHbA. All of the samples are in the solution phase at pH 6.5 maintained at ~ 4 C
Figure 2
Figure 2
The low frequency portion of the Soret enhanced resonance Raman spectrum of sol-gel encapsulated hemoglobins as a function of ligation for the Hb(Nβ102A) mutant, with spectra from encapsulated HbA presented for comparison. a. [deoxy HbA], b. [deoxy Hb(Nβ102A+IHP], c. [deoxy Hb(Nβ102A)+IHP]+CO after 1 hour, d. [COHb(Nβ102A)+IHP], e. [CO HbA].
Figure 3
Figure 3
A comparison of the high frequency portion of the 229 nm excited UV resonance Raman spectrum of deoxy (solid line) and CO (dashed line) derivatives of the following samples: a. HbA in solution, b. Hb(Nβ102A)+IHP in solution, c. encapsulated deoxy and CO derivatives of Hb(Nβ102A)+IHP and d. encapsulated deoxy Hb(Nβ102A)+IHP before and after addition of CO. In each instance, the deoxy-CO difference spectrum (solid –dashed lines) is shown below the two individual spectra. Both the W3 and Y8a bands have been independently normalized (hence the back slash dividing the spectra at approximately 1580 cm−1) to better demonstrate the frequency differences for each of these two bands.
Fig. 4
Fig. 4
Traces depicting CO rebinding to photodissociated CO saturated hemoglobin derivatives at pH 6.5 at 3.5 C in solution displayed on a log-log plot of normalized absorbance versus time for the following samples: a. COHbA(αZn/βFe) +IHP, b. COHb(Nβ102A) + IHP and L35, c. COHbA under high photodissociation limit, and d. COHbA in the low photodissociation limit. Except for trace c all traces were generated under the low photodissociation conditions (no difference between the high and low limits for traces a and b).
Fig. 5
Fig. 5
a. CO recombination on a log-log plot for solution phase samples in the low photodissociation limit: a. COHb(Nβ102A)+IHP + L35, b. COHb(Nβ102A)+L35, c. COHb(Nβ102A), d. COHbA). See text for experimental details. b. The MEM (maximum entropy method) kinetic populations displayed as 1/k on a log time scale derived from CO rebinding traces from the following solution phase samples: a. COHb(Nβ102A)+IHP+L35, b. COHb(Nβ102A)+L35, c. COHb(Nβ102A) and d. COHbA. The kinetic populations are grouped into two categories: geminate recombination (GR) and bimolecular recombination (BR). The focus of the present study is primarily on the BR (bimolecular recombination) populations which have been subdivided into an R state (R), three LT (low affinity T state) and one HT (high affinity T state) population. As can be seen in Table 2, each of the LT and the HT categories covers a range of values. The labels in the figure provide a rough indication of where each of these variable populations appears. The origin and nature of the multiple geminate and intermediate phases (between ten and a hundred microseconds) seen in the figure are the focus of a future paper.
Fig. 5
Fig. 5
a. CO recombination on a log-log plot for solution phase samples in the low photodissociation limit: a. COHb(Nβ102A)+IHP + L35, b. COHb(Nβ102A)+L35, c. COHb(Nβ102A), d. COHbA). See text for experimental details. b. The MEM (maximum entropy method) kinetic populations displayed as 1/k on a log time scale derived from CO rebinding traces from the following solution phase samples: a. COHb(Nβ102A)+IHP+L35, b. COHb(Nβ102A)+L35, c. COHb(Nβ102A) and d. COHbA. The kinetic populations are grouped into two categories: geminate recombination (GR) and bimolecular recombination (BR). The focus of the present study is primarily on the BR (bimolecular recombination) populations which have been subdivided into an R state (R), three LT (low affinity T state) and one HT (high affinity T state) population. As can be seen in Table 2, each of the LT and the HT categories covers a range of values. The labels in the figure provide a rough indication of where each of these variable populations appears. The origin and nature of the multiple geminate and intermediate phases (between ten and a hundred microseconds) seen in the figure are the focus of a future paper.
Fig. 6
Fig. 6
a. CO recombination on a log-log plot for encapsulated hemoglobin samples in the low photodissociation limit: a. [deoxyHb(Nβ102A)+IHP]+CO, b. [COHb(Nβ102A)+IHP], c. [COHbA+IHP], and d. [COHbA]. See text for nomenclature and experimental conditions. b. The MEM (maximum entropy method) kinetic analysis displayed as 1/k on a log time scale derived from CO rebinding traces from the following samples: a. [deoxyHb(Nβ102A)+IHP]+CO, b. [COHb(Nβ102A)+IHP], c. [COHbA+IHP], and d. [COHbA].
Fig. 6
Fig. 6
a. CO recombination on a log-log plot for encapsulated hemoglobin samples in the low photodissociation limit: a. [deoxyHb(Nβ102A)+IHP]+CO, b. [COHb(Nβ102A)+IHP], c. [COHbA+IHP], and d. [COHbA]. See text for nomenclature and experimental conditions. b. The MEM (maximum entropy method) kinetic analysis displayed as 1/k on a log time scale derived from CO rebinding traces from the following samples: a. [deoxyHb(Nβ102A)+IHP]+CO, b. [COHb(Nβ102A)+IHP], c. [COHbA+IHP], and d. [COHbA].
Fig. 7
Fig. 7
a. CO recombination on a log-log plot for encapsulated hemoglobin samples in the low photodissociation limit: a [COHb(Wβ37E: αZn/βFe)+IHP], b. [deoxyXLHb(W(β37E)+IHP]+CO, c. [COXLHb(Wβ37E)+IHP], d. [COHbA]. See text for nomenclature and experimental conditions. b.The MEM (maximum entropy method) kinetic analysis displayed as 1/k on a log time scale derived from CO rebinding traces from the following sol-gel encapsulated samples: a [COHb(Wβ37E: αZn/βFe)+IHP], b. [deoxyXLHb(W(β37E)+IHP]+CO, c. [COXLHb(Wβ37E)+IHP], d. [COHbA].
Fig. 7
Fig. 7
a. CO recombination on a log-log plot for encapsulated hemoglobin samples in the low photodissociation limit: a [COHb(Wβ37E: αZn/βFe)+IHP], b. [deoxyXLHb(W(β37E)+IHP]+CO, c. [COXLHb(Wβ37E)+IHP], d. [COHbA]. See text for nomenclature and experimental conditions. b.The MEM (maximum entropy method) kinetic analysis displayed as 1/k on a log time scale derived from CO rebinding traces from the following sol-gel encapsulated samples: a [COHb(Wβ37E: αZn/βFe)+IHP], b. [deoxyXLHb(W(β37E)+IHP]+CO, c. [COXLHb(Wβ37E)+IHP], d. [COHbA].
Fig. 8
Fig. 8
a. CO recombination on a log-log plot for [deoxy HbA]+CO as a function of preparative protocol: a. [deoxyHbA]+CO, the sample was extensively aged prior to addition of CO; b. [deoxyHbA]+CO, prepared using the LT protocol (32), c. [deoxyHbA]+CO prepared using the HT protocol (32), the trace was generated one month after addition of CO, d. [COHbA]. See text for nomenclature and experimental conditions. b. The MEM (maximum entropy method) kinetic analysis displayed as 1/k on a log time scale derived from CO rebinding traces from [deoxyHbA]+CO samples as a function of time subsequent to the addition of the CO. a. [deoxyHbA]+CO, the sample was extensively aged prior to addition of CO; b. [deoxyHbA]+CO, prepared using the LT protocol (32), c. [deoxyHbA]+CO prepared using the HT protocol (32), the trace was generated one month after addition of CO, d. [COHbA]. See text for nomenclature and experimental conditions. The asterisks designate a region where a peak was cosmetically removed (see text).
Fig. 8
Fig. 8
a. CO recombination on a log-log plot for [deoxy HbA]+CO as a function of preparative protocol: a. [deoxyHbA]+CO, the sample was extensively aged prior to addition of CO; b. [deoxyHbA]+CO, prepared using the LT protocol (32), c. [deoxyHbA]+CO prepared using the HT protocol (32), the trace was generated one month after addition of CO, d. [COHbA]. See text for nomenclature and experimental conditions. b. The MEM (maximum entropy method) kinetic analysis displayed as 1/k on a log time scale derived from CO rebinding traces from [deoxyHbA]+CO samples as a function of time subsequent to the addition of the CO. a. [deoxyHbA]+CO, the sample was extensively aged prior to addition of CO; b. [deoxyHbA]+CO, prepared using the LT protocol (32), c. [deoxyHbA]+CO prepared using the HT protocol (32), the trace was generated one month after addition of CO, d. [COHbA]. See text for nomenclature and experimental conditions. The asterisks designate a region where a peak was cosmetically removed (see text).
Fig. 9
Fig. 9
A hypothetical reaction coordinate diagram that depicts the proposed evolution of T state tertiary structure upon ligand binding. Perpendicular to this reaction coordinate is the reaction coordinate for the T→R transition. The numbered potential minima represent different T state species that are progressively accessed subsequent to ligand binding. For HbA, the initial deoxy population is dominated by the potential well labeled 1 which prior to ligand binding would be much deeper than shown. The progression from 1 to 5 represents the T state tetramer relaxation from the low affinity T (LT) to high affinity T (HT). In going from LT to HT (i.e. 1→5), the α1β2 interface loosens, proximal strain decreases and the barrier for the T→R switch is reduced resulting in a progressive increase in the T to R rate constant. Thus for each T state conformation (designated 1–5) there is a corresponding T to R rate constant, kn(Tn→R), with n being the designation for the specific T state. These rate constants increase as n goes from 1 to 5. Sol-gel encapsulation greatly slows k(T→R) relative to the LT→HT transition. The overall energy surface is portrayed as a rough energy landscape based on the diffusive-like evolution of conformation observed for the sol-gel samples.

Similar articles

Cited by

References

    1. Monod J, Wyman J, Changeux JP. On the Nature of Allosteric Transitions: A Plausible Model. J Mol Biol. 1965;12:88–118. - PubMed
    1. Eaton WA, Henry ER, Hofrichter J, Mozzarelli A. Is cooperative oxygen binding by hemoglobin really understood? Nat Struct Biol. 1999;6:351–358. - PubMed
    1. Perutz MF, Fermi G, Luisi B, Shaanan B, Liddington RC. Stereochemistry of cooperative mechanisms in hemoglobin. Cold Spring Harb Symp Quant Biol. 1987;52:555–565. - PubMed
    1. Perutz MF, Wilkinson AJ, Paoli M, Dodson GG. The stereochemical mechanism of the cooperative effects in hemoglobin revisited. Annu Rev Biophys Biomol Struct. 1998;27:1–34. - PubMed
    1. Shulman RG, Ogawa S, Hopfield JJ. An allosteric model of hemoglobin. Cold Spring Harb Symp Quant Biol. 1972;36:337–341. - PubMed

Publication types