. 2006 Feb 17:2:8.
doi: 10.1186/1744-8069-2-8.

Depression of presynaptic excitation by the activation of vanilloid receptor 1 in the rat spinal dorsal horn revealed by optical imaging

Affiliations

Depression of presynaptic excitation by the activation of vanilloid receptor 1 in the rat spinal dorsal horn revealed by optical imaging

Kei Kusudo et al. Mol Pain. .

Abstract

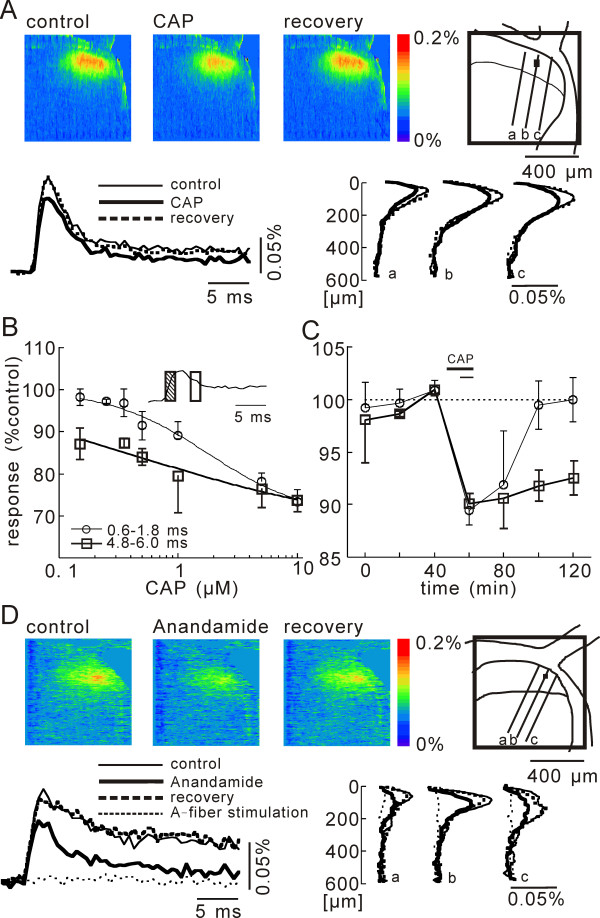
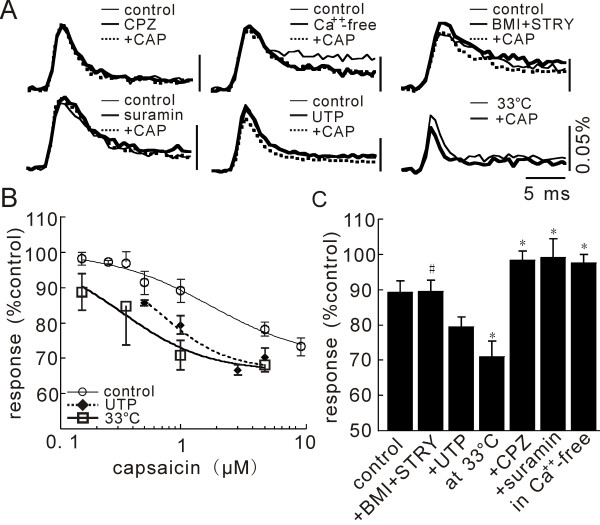
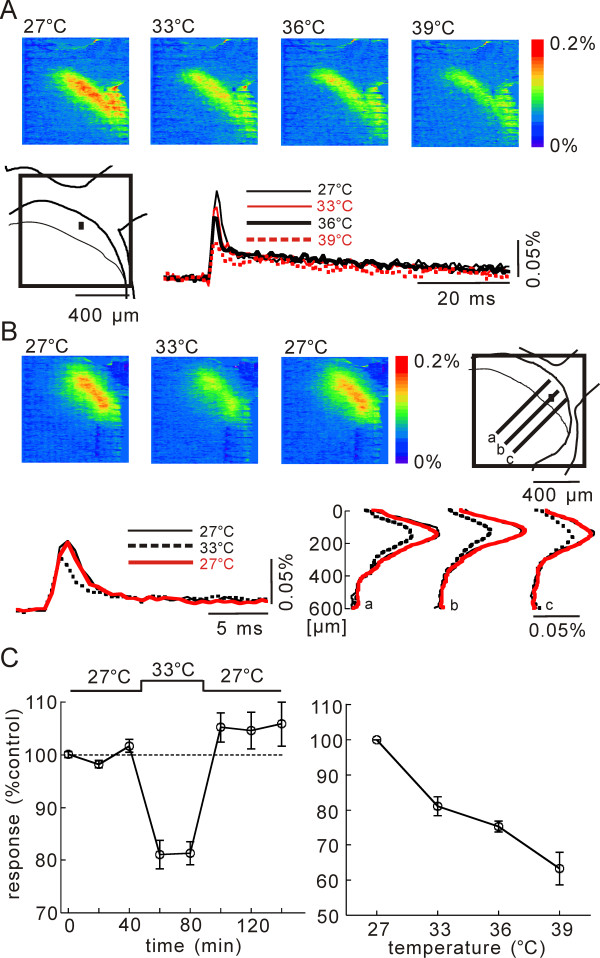
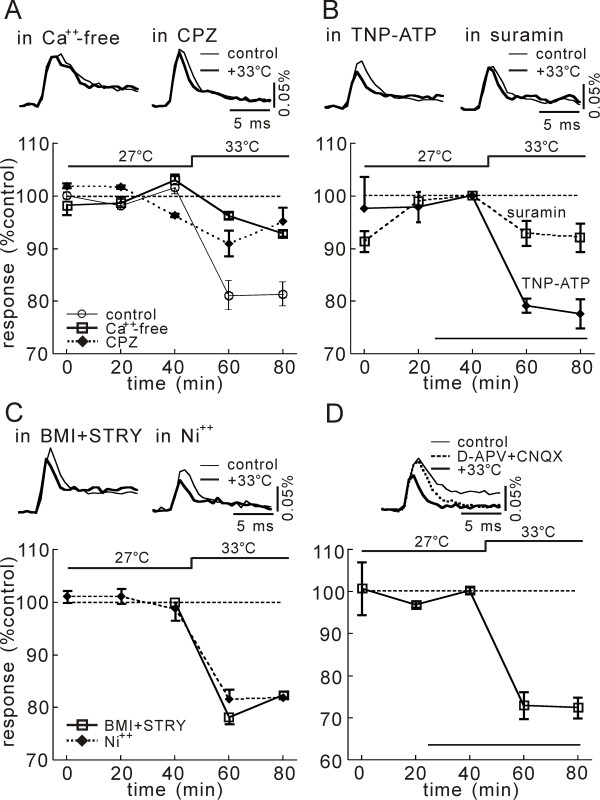
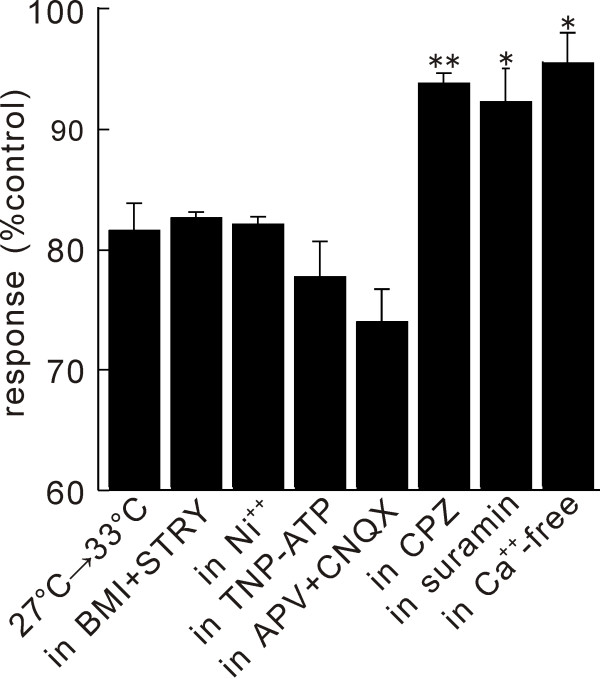
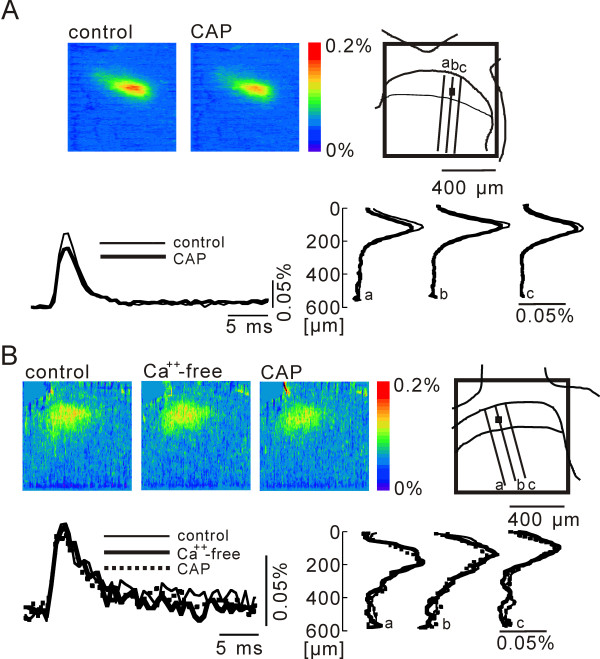
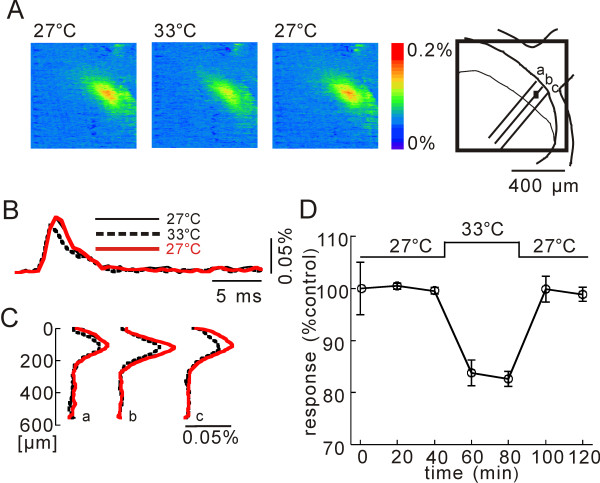
In this study, we show that capsaicin (CAP) depresses primary afferent fiber terminal excitability by acting on vanilloid receptor 1 (TRPV1 channels) of primary afferent fibers in adenosine 5'-triphosphate (ATP)- and temperature-dependent manner using two optical imaging methods. First, transverse slices of spinal cord were stained with a voltage-sensitive dye and the net excitation in the spinal dorsal horn was recorded. Prolonged treatment (>20 min) with the TRPV1 channel agonist, CAP, resulted in a long-lasting inhibition of the net excitation evoked by single-pulse stimulation of C fiber-activating strength. A shorter application of CAP inhibited the excitation in a concentration-dependent manner and the inhibition was reversed within several minutes. This inhibition was Ca(++)-dependent, was antagonized by the TRPV1 channel antagonist, capsazepine (CPZ), and the P(2)X and P(2)Y antagonist, suramin, and was facilitated by the P(2)Y agonist, uridine 5'-triphosphate (UTP). The inhibition of excitation was unaffected by bicuculline and strychnine, antagonists of GABA(A) and glycine receptors, respectively. Raising the perfusate temperature to 39 degrees C from 27 degrees C inhibited the excitation (-3%/ degrees C). This depressant effect was antagonized by CPZ and suramin, but not by the P(2)X antagonist, 2', 3'-O-(2,4,6-trinitrophenyl) adenosine 5'-triphosphate (TNP-ATP). Second, in order to record the presynaptic excitation exclusively, we stained the primary afferent fibers anterogradely from the dorsal root. CAP application and a temperature increase from 27 degrees C to 33 degrees C depressed the presynaptic excitation, and CPZ antagonized these effects. Thus, this study showed that presynaptic excitability is modulated by CAP, temperature, and ATP under physiological conditions, and explains the reported central actions of CAP. These results may have clinical importance, especially for the control of pain.


Figures

Figure 1
Figure 1
Depression of afferent-evoked net neuronal excitation by CAP. A) A pseudo-color image sequence of stimulation-induced net optical responses measured from a slice bathed in a control solution (left), a CAP (0.5 μM)-containing solution (center), and the control solution for recovery (right). At left bottom, superimposed time traces obtained at the black square in the schematic drawing are illustrated for the respective images. At right bottom, the spatial distributions along the dorso-ventral lines in the schematic drawings are also illustrated. B) Concentration-dependent inhibition of net neuronal excitation by CAP at the period of 0.6–1.8 ms in evoked response (circles), and of 4.8–6.0 ms (squares). The curves were drawn according to the equation I = Imax/[1+(IC50/[CAP])N] (IC50 = 0.5 μM & Imax = -30% N = 1.0 at 0.6–1.8 ms of evoked response, and IC50 = 1.7 μM & Imax = -33% N = 0.5 at 4.8–6.0 ms of evoked response) C) Changes in normalized time courses of the magnitudes of net neuronal excitation by CAP application with two different durations, 10 and 20 min (circles and squares, respectively). The period of CAP application is indicated by the bar. D) Pseudo-color image sequence of stimulation-induced net optical responses measured from a slice bathed in a control solution (left), a anandamide (50 μM)-containing solution (center), and the control solution for recovery (right). At left bottom, superimposed time traces obtained at the black square in the schematic drawing are illustrated for the respective images and at A-fiber stimulation. At right bottom, the spatial distributions along the dorso-ventral lines a, b and c in the schematic drawings are also illustrated. Excitation evoked by the dorsal root stimulation of A-fiber-activating strength in the normal condition is illustrated with dotted lines in the time traces and the spatial distributions. No detectable changes were observed.
Figure 2
Figure 2
Pharmacology of CAP-induced depression of net neuronal excitation. A) Time traces obtained using various agents. The effect of CAP was antagonized by the vanilloid receptor 1 antagonist, CPZ (20 μM), suramin (100 μM), and a Ca++-free medium. It was not affected by BMI (10 μM) and STRY (3 μM), and was potentiated by UTP (30 μM) and at a higher temperature of 33°C. B) Concentration dependencies of CAP effect in normal solution at 27°C (circles) and 33°C (squares), and in UTP at 27°C (diamonds). Points were fitted with IC50 = 1.7 μM, Imax = -30% and N = 1.0 for 27°C, IC50 = 0.3 μM, Imax = -34% and N = 1.2 for 33°C, and IC50 = 0.6 μM, Imax = -33% and N = 1.5 for UTP. C) Averaged percent control response in various agents in 4–6 slices. Statistical significance and insignificance to control change are indicated with signs, * (p < 0.05) and # (p > 0.5), respectively. Although +UTP was not significant, it shifted the dose-response curve reasonably well (diamonds in C).
Figure 3
Figure 3
Effect of temperature increase on C-fiber evoked net excitation. A) Pseudo-color image sequence of stimulation-induced optical responses measured in a slice in perfusion solution at 27°C, 33°C, 36°C, and 39°C (from left to right). Superimposed time traces of optical signals obtained at 27°C (thin black), 33°C (thin red), 36°C (bold black), and 39°C (dashed red). These records were obtained by spatial average of the optical signals of 8 × 8 pixels corresponding to the black square area (50 × 50 μm) shown in the schematic drawing of the dorsal horn. Dotted line in the optical signal records indicates the baseline level. B) Pseudo-color image sequence of stimulation-induced optical responses measured from slices bathed in 27°C, 33°C, and 27°C (form left to right). Superimposed time traces obtained at 27°C (thin black), 33°C (dashed black), and 27°C (red) are indicated at left below. Spatial distributions of the magnitude of excitation along lines in schematic drawing are illustrated at right below. C) Normalized time course of magnitude of optical signals showing the averaged effect induced by a change of temperature from 27°C to 33°C (left), and the averaged temperature-dependency of depression (right), in 4 slices.
Figure 4
Figure 4
Pharmacology of temperature effect on net excitation. A) Antagonism by CPZ (20 μM) and a Ca++-free medium. Upper inserts show the time traces of optical signals at 27°C (thin) and 33°C (bold). Bottom graph shows the averaged changes in normalized magnitude of optical signal obtained in 4 slices when temperature was altered from 27°C to 33°C as indicated by the bar above. Circles, squares and diamonds indicate results obtained in the normal solution (control), in a Ca++-free medium, and CPZ-containing solution, respectively. B) Antagonism by suramin (100 μM) and potentiation by TNP-ATP (1 μM). Bottom line in the graph indicates the duration of drug application. C) No effect of BMI (10 μM) and STRY (3 μM) (squares), and Ni++ (diamonds) is observed on temperature effect. D) Augmented effect in APV (50 μM) and CNQX (10 μM).
Figure 5
Figure 5
Changes of net excitation induced by temperature increase from 27°C to 33°C in various conditions. Each bar exhibits the averaged results obtained in 4–7 slices. Statistical significance to control change is indicated with signs, ** (p < 0.01) and * (p < 0.05), respectively.
Figure 6
Figure 6
Depression of presynaptic excitation by CAP. A) Pseudo-color image sequence of stimulation-induced presynaptic excitation measured from a slice in the control solution (left) and with CAP (right) at 27°C. Superimposed time traces at the black square in the schematic drawing, as well as spatial distributions along the dorso-ventral lines a, b and c, are illustrated at bottom. B) No effect of CAP in a Ca++-free condition.
Figure 7
Figure 7
Effect of temperature increase on presynaptic excitation. A) Pseudo-color image sequence of stimulation-induced optical responses measured in the solution at 27°C, 33°C, and 27°C in a slice (from left to right). B) Superimposed time traces of optical signals obtained at 27°C (black), 33°C (dashed black), and 27°C (red). These records were obtained by spatial average of the optical signals of 8 × 8 pixels corresponding to a black square area (50 × 50 μm) shown in the schematic drawing of the dorsal horn. Dotted line in the optical signal records indicates the baseline level. C) Spatial distributions of the magnitude of excitation along dorso-ventral lines a, b and c in schematic drawing. D) Normalized time course of magnitude of optical signals showing the averaged effect induced by a change of temperature from 27°C to 33°C.

Similar articles

Cited by

References

    1. Yaksh TL, Farb DH, Leeman SE, Jessell TM. Intrathecal capsaicin depletes substance P in the rat spinal cord and produces prolonged thermal analgesia. Science. 1979;206:481–483. - PubMed
    1. Miller MS, Buck SH, Sipes IG, Burks TF. Capsaicinoid-induced local and systemic antinociception without substance P depletion. Brain Res. 1982;244:193–197. doi: 10.1016/0006-8993(82)90921-0. - DOI - PubMed
    1. Micevych PE, Yaksh TL, Szolcsanyi J. Effect of intrathecal capsaicin analogues on the immunofluorescence of peptides and serotonin in the dorsal horn in rats. Neuroscience. 1983;8:123–131. doi: 10.1016/0306-4522(83)90031-3. - DOI - PubMed
    1. Jhamandas K, Yaksh TL, Harty G, Szolcsanyi J, Go VL. Action of intrathecal capsaicin and its structural analogues on the content and release of spinal substance P: selectivity of action and relationship to analgesia. Brain Res. 1984;306:215–225. doi: 10.1016/0006-8993(84)90371-8. - DOI - PubMed
    1. Nagy JI, Emson PC, Iversen LL. A re-evaluation of the neurochemical and antinociceptive effects of intrathecal capsaicin in the rat. Brain Res. 1981;211:497–502. doi: 10.1016/0006-8993(81)90980-X. - DOI - PubMed

Publication types

LinkOut - more resources