. 2006 Feb 17:7:78.
doi: 10.1186/1471-2105-7-78.

Biclustering of gene expression data by Non-smooth Non-negative Matrix Factorization

Affiliations

Biclustering of gene expression data by Non-smooth Non-negative Matrix Factorization

Pedro Carmona-Saez et al. BMC Bioinformatics. .

Abstract

Background: The extended use of microarray technologies has enabled the generation and accumulation of gene expression datasets that contain expression levels of thousands of genes across tens or hundreds of different experimental conditions. One of the major challenges in the analysis of such datasets is to discover local structures composed by sets of genes that show coherent expression patterns across subsets of experimental conditions. These patterns may provide clues about the main biological processes associated to different physiological states.

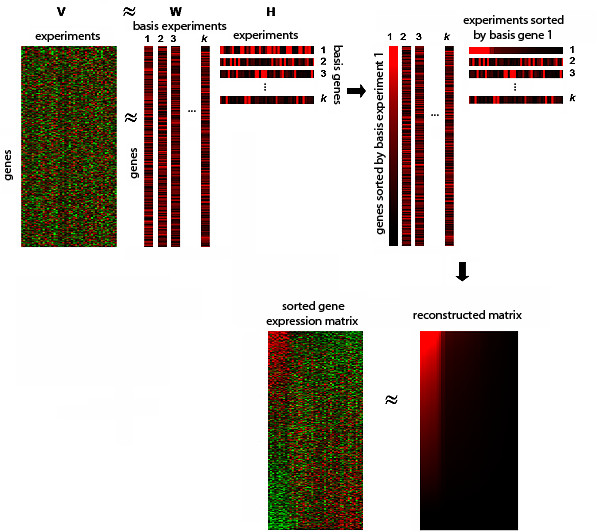
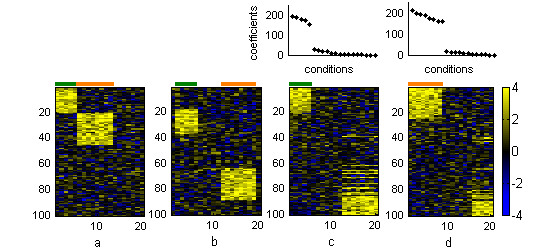
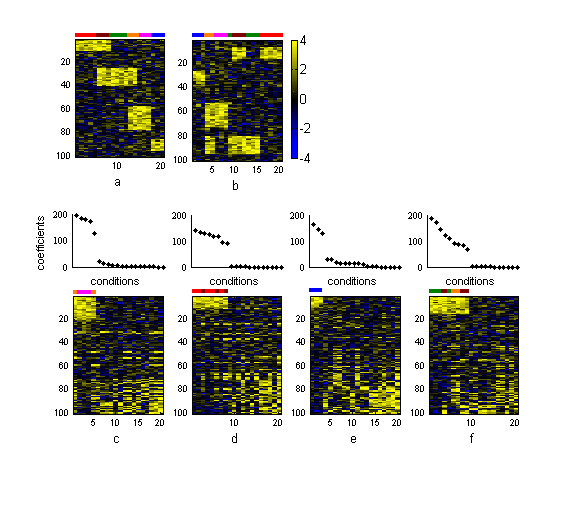
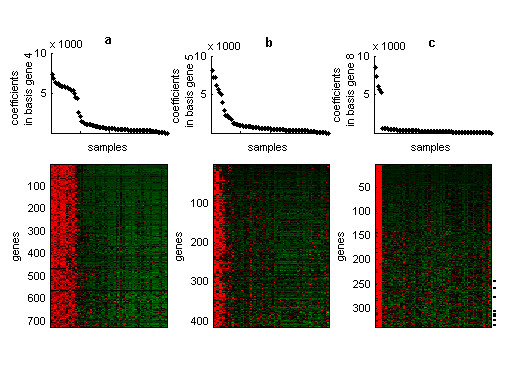
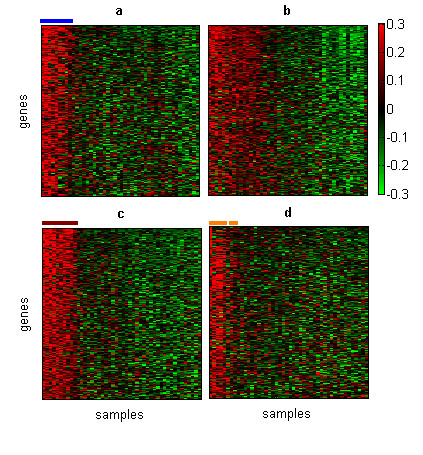
Results: In this work we present a methodology able to cluster genes and conditions highly related in sub-portions of the data. Our approach is based on a new data mining technique, Non-smooth Non-Negative Matrix Factorization (nsNMF), able to identify localized patterns in large datasets. We assessed the potential of this methodology analyzing several synthetic datasets as well as two large and heterogeneous sets of gene expression profiles. In all cases the method was able to identify localized features related to sets of genes that show consistent expression patterns across subsets of experimental conditions. The uncovered structures showed a clear biological meaning in terms of relationships among functional annotations of genes and the phenotypes or physiological states of the associated conditions.

Conclusion: The proposed approach can be a useful tool to analyze large and heterogeneous gene expression datasets. The method is able to identify complex relationships among genes and conditions that are difficult to identify by standard clustering algorithms.


Figures

Figure 1
Figure 1
General schema of the method nsNMF approximates the original matrix as a product of two submatrices, W and H. Columns of W are basis experiments while rows of H constitute basis genes (columns of W and rows of H are separated for a better visibility). Coefficients in each pair of basis gene and experiment are used to sort conditions and genes in the original matrix. Conditions and genes with high values in the same basis gene and basis experiment are highly related in a sub-portion of the data and are co-clustered in the upper left corner of the sorted array.
Figure 2
Figure 2
Results from synthetic dataset A (a) Original dataset with the two embedded patterns. (b) Dataset sorted by two-way hierarchical clustering. Dataset sorted by (c) the first basis gene and basis experiment and (d) the second basis gene and basis experiment yielded by nsNMF at k = 3. Conditions belonging to pattern Pla are marked in green and conditions belonging to pattern P2a are depicted in orange. The two plots over the heatmaps represent the coefficients of conditions in each sorted basis gene.
Figure 3
Figure 3
Results from synthetic dataset B (a) Original dataset with the three embedded patterns and (b) the same dataset sorted by two-way hierarchical clustering. Heatmaps of the original dataset sorted by the (c) first, (d) second, (e) third and (f) fourth basis genes and basis experiments yielded by nsNMF at k = 4 are shown in the bottom part of the figure. Non-overlapping conditions of Plb are marked in red, non-overlapping conditions of P2b are marked in green and non-overlapping conditions of P3b are marked in magenta. The overlapped area between Plb and P2b is marked in brown while the overlapped columns between P2b and P3b are marked in orange. Columns of P4b are marked in blue. Plots over the heatmaps represent coefficients of conditions in each sorted basis gene. The sorted basis genes present gaps indicating the set of conditions belonging to each pattern.
Figure 4
Figure 4
Structures from the human transcriptome dataset Plots in the first row represent coefficients of samples in the (a) fourth, (b) fifth and (c) eighth sorted basis genes. Heatmaps in the second row represent the expression matrix in which genes (in rows) and samples (in columns) are sorted by their coefficients in the corresponding basis experiment and basis gene. Only genes that were highly representative of each basis experiment are shown. Dash lines in the third heatmap represent positions of genes that were included in the testis-gene module but were clustered in distant positions to the testis-gene group by hierarchical clustering.
Figure 5
Figure 5
Structures from the soft-tissue tumor dataset Each heatmap represents the expression matrix in which samples and genes were sorted by (a) the first, (b) second, (c) third and (d) fourth basis gene and basis experiment. Only genes that were selected as highly representative of each basis experiment are shown. Blue line corresponds to monophasic synovial sarcomas, brown line to gastrointestinal stromal tumors and orange line to six of the eleven leiomyosarcomas samples.

References

    1. Stoughton RB. Applications of DNA Microarrays in Biology. Annu Rev Biochem. 2004 - PubMed
    1. Hsiao LL, Dangond F, Yoshida T, Hong R, Jensen RV, Misra J, Dillon W, Lee KF, Clark KE, Haverty P, Weng Z, Mutter GL, Frosch MP, Macdonald ME, Milford EL, Crum CP, Bueno R, Pratt RE, Mahadevappa M, Warrington JA, Stephanopoulos G, Gullans SR. A compendium of gene expression in normal human tissues. Physiol Genomics. 2001;7:97–104. - PubMed
    1. Hughes TR, Marton MJ, Jones AR, Roberts CJ, Stoughton R, Armour CD, Bennett HA, Coffey E, Dai H, He YD, Kidd MJ, King AM, Meyer MR, Slade D, Lum PY, Stepaniants SB, Shoemaker DD, Gachotte D, Chakraburtty K, Simon J, Bard M, Friend SH. Functional discovery via a compendium of expression profiles. Cell. 2000;102:109–126. doi: 10.1016/S0092-8674(00)00015-5. - DOI - PubMed
    1. Shyamsundar R, Kim YH, Higgins JP, Montgomery K, Jorden M, Sethuraman A, van de Rijn M, Botstein D, Brown PO, Pollack JR. A DNA microarray survey of gene expression in normal human tissues. Genome Biol. 2005;6:R22. doi: 10.1186/gb-2005-6-3-r22. - DOI - PMC - PubMed
    1. Su AI, Cooke MP, Ching KA, Hakak Y, Walker JR, Wiltshire T, Orth AP, Vega RG, Sapinoso LM, Moqrich A, Patapoutian A, Hampton GM, Schultz PG, Hogenesch JB. Large-scale analysis of the human and mouse transcriptomes. Proc Natl Acad Sci USA. 2002;99:4465–4470. doi: 10.1073/pnas.012025199. - DOI - PMC - PubMed

Publication types

MeSH terms