

Measuring health inequalities in Albania: a focus on the distribution of general practitioners
- PMID: 16504028
- PMCID: PMC1395320
- DOI: 10.1186/1478-4491-4-5
Measuring health inequalities in Albania: a focus on the distribution of general practitioners
Abstract
Background: The health workforce has a dynamically changing nature and the regular documentation of the distribution of health professionals is a persistent policy concern. The aim of the present study was to examine available human medical resources in primary care and identify possible inequalities regarding the distribution of general practitioners in Albania between 2000 and 2004.
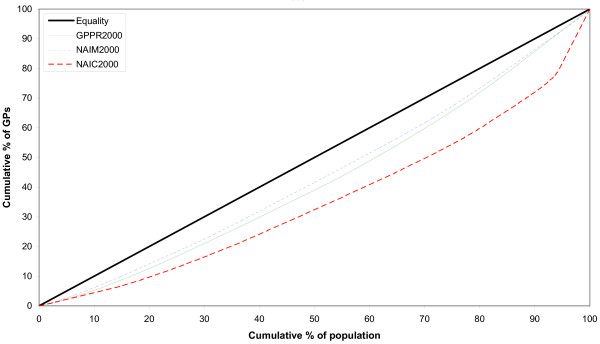
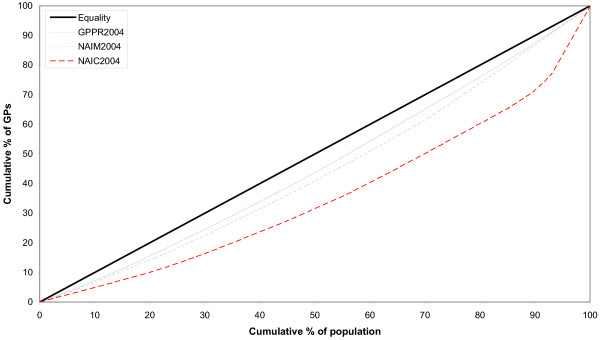
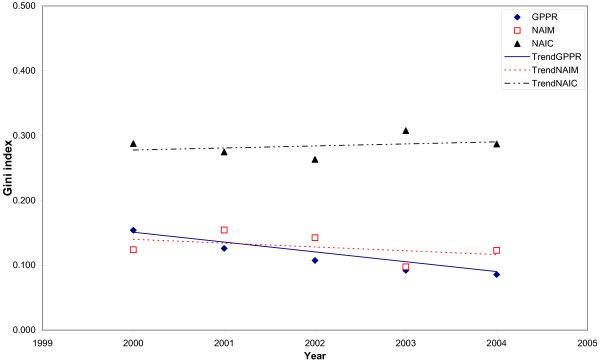
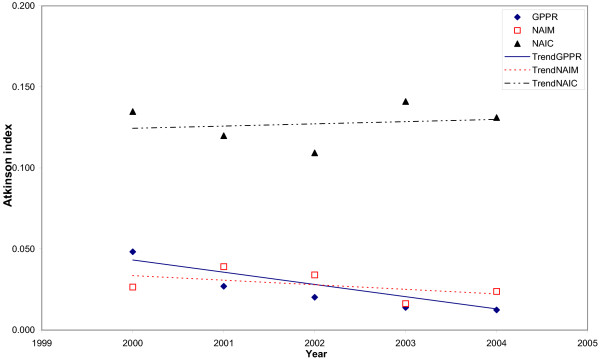
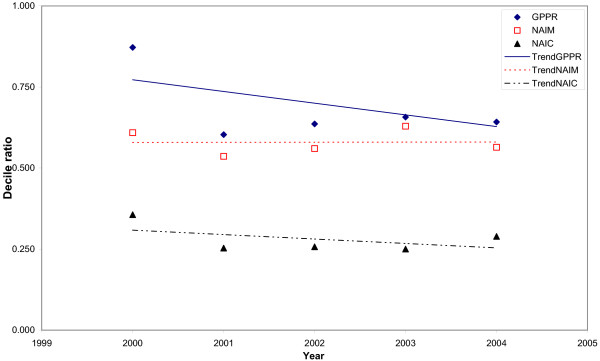
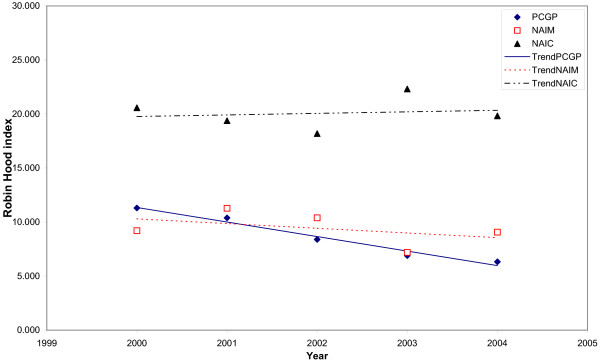
Methods: With census data, we investigated the degree of inequality by calculating relative inequality indices. We plotted the Lorenz curves and calculated the Gini, Atkinson and Robin Hood indices and decile ratios, both before and after adjusting for mortality and consultation rates.
Results: The Gini index for the distribution of general practitioners in 2000 was 0.154. After adjusting for mortality it was 0.126, while after adjusting for consultation rates it was 0.288. The Robin Hood index for 2000 was 11.2%, which corresponds to 173 general practitioners who should be relocated in order to achieve equality. The corresponding figure after adjusting for mortality was 9.2% (142 general practitioners), while after adjusting for consultation rates the number was 20.6% (315). These figures changed to 6.3% (100), 6.3% (115) and 19.8% (315) in 2004.
Conclusion: There was a declining trend in the inequality of distribution of general practitioners in Albania between 2000 and 2004. The trend in inequality was apparent irrespective of the relative inequality indicator used. The level of inequality varied depending on the adjustment method used. Reallocation strategies for general practitioners in Albania could be the key in alleviating the inequalities in primary care workforce distribution.
Figures
References
-
- Health care systems in transition: Albania http://www.euro.who.int/observatory
-
- Albanian Health System Reform. Position paper on policy and strategies for the Albanian health sector reform. Tirana, Ministry of Health of Albania; 1999.
-
- Rrumbullaku L, Theodorakis PN, Caca P, Lionis C, Trell E. Medical education in Albania: current situation and perspective, with reference to primary care. Croat Med J. 2002;43:50–53. - PubMed
-
- Towards unity for health. Geneva, World Health Organization; 1999.
LinkOut - more resources
Full Text Sources
