. 2006 Feb 21:7:83.
doi: 10.1186/1471-2105-7-83.

CARAT: a novel method for allelic detection of DNA copy number changes using high density oligonucleotide arrays

Affiliations

CARAT: a novel method for allelic detection of DNA copy number changes using high density oligonucleotide arrays

Jing Huang et al. BMC Bioinformatics. .

Abstract

Background: DNA copy number alterations are one of the main characteristics of the cancer cell karyotype and can contribute to the complex phenotype of these cells. These alterations can lead to gains in cellular oncogenes as well as losses in tumor suppressor genes and can span small intervals as well as involve entire chromosomes. The ability to accurately detect these changes is central to understanding how they impact the biology of the cell.

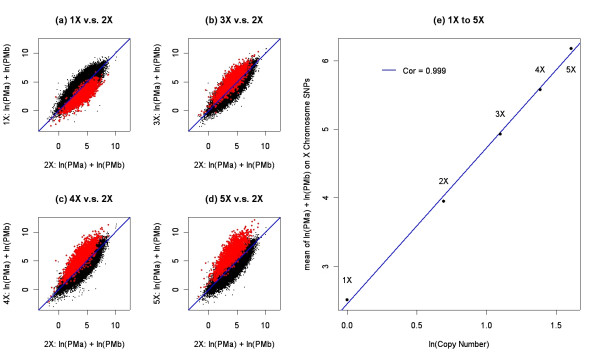
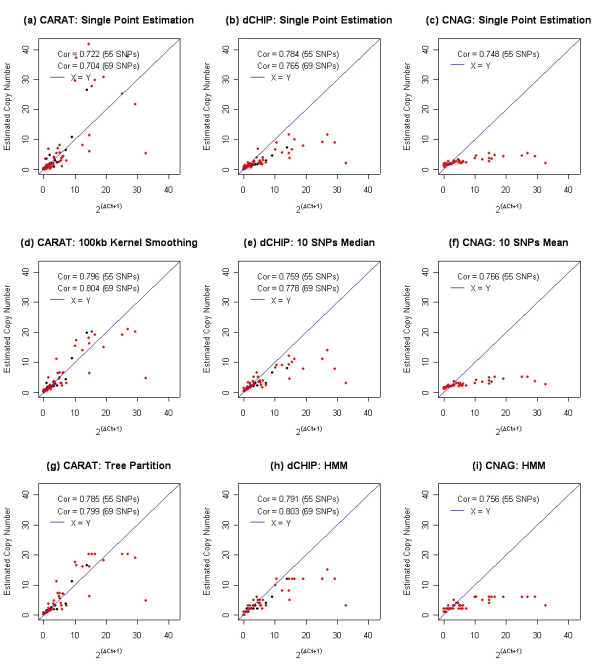
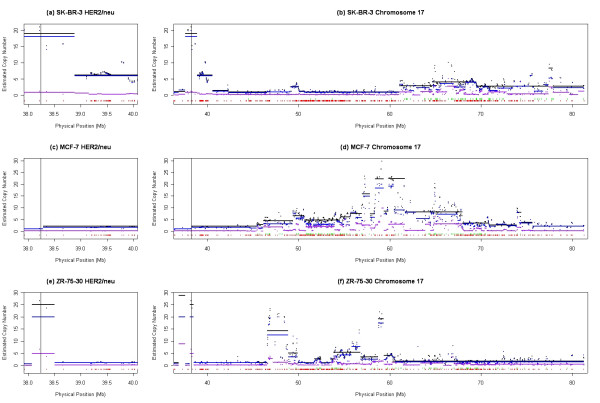
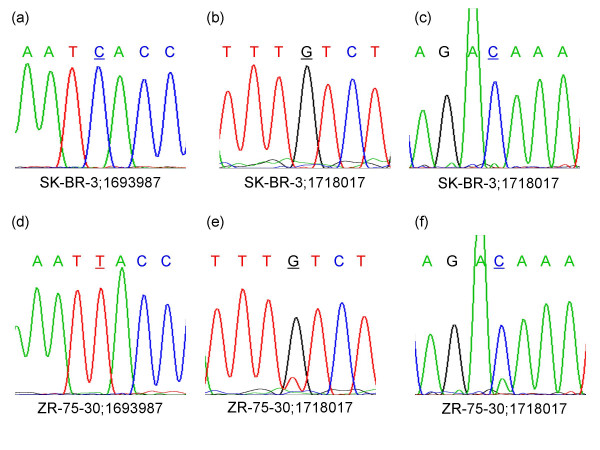
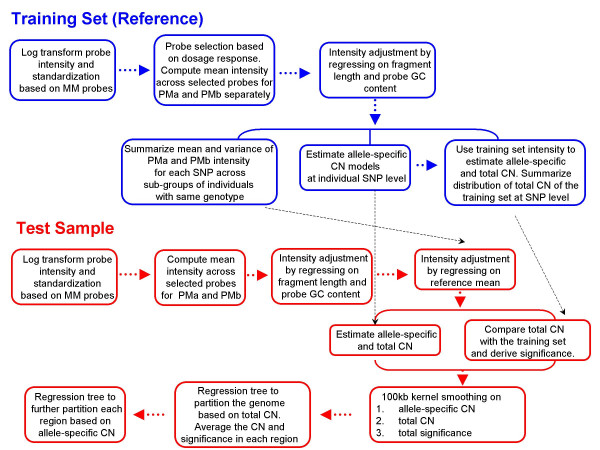
Results: We describe a novel algorithm called CARAT (Copy Number Analysis with Regression And Tree) that uses probe intensity information to infer copy number in an allele-specific manner from high density DNA oligonuceotide arrays designed to genotype over 100,000 SNPs. Total and allele-specific copy number estimations using CARAT are independently evaluated for a subset of SNPs using quantitative PCR and allelic TaqMan reactions with several human breast cancer cell lines. The sensitivity and specificity of the algorithm are characterized using DNA samples containing differing numbers of X chromosomes as well as a test set of normal individuals. Results from the algorithm show a high degree of agreement with results from independent verification methods.

Conclusion: Overall, CARAT automatically detects regions with copy number variations and assigns a significance score to each alteration as well as generating allele-specific output. When coupled with SNP genotype calls from the same array, CARAT provides additional detail into the structure of genome wide alterations that can contribute to allelic imbalance.


Figures

Figure 1
Figure 1
Panels a-d show the standardized ln(PMa) + ln(PMb) intensity for the 1X, 3X, 4X, and 5X DNA samples relative to the intensity of the 2X DNA sample. Black data points correspond to autosomal SNPs and red data points correspond to the 1,955 X-chromosome SNPs. The blue line in each panel represents the Y = X line. Panel e shows the relationship between the natural log-transformed copy number and the natural log-transformed intensity. The x-axis is the natural log-transformed copy number and the y axis is the average ln(PMa) + ln(PMb) intensity across 1,955 SNPs. The blue line is the regression using the average intensity as the response and the natural log-transformed copy number as the predictor.
Figure 2
Figure 2
The upper panel shows the mean autosomal SNP copy number and the associated standard deviation using kernel smoothing alone and kernel smoothing combined with the tree partition for each of the 90 normal samples in the independent test set. The solid lines correspond to the mean estimation and the dotted lines represent the mean plus or minus one standard deviation. The lower panel shows the proportion of the genome (autosomal chromosomes only) that is determined to be in the normal diploid state for the 90 individuals. The blue colored lines in both panels represent results using kernel smoothing alone while the red colored lines represent results from kernel smoothing combined with the regression tree partition.
Figure 3
Figure 3
Each panel shows a series of ROC curves derived from different stages of CARAT using samples with X chromosome alterations. Stage 1: Single point analysis that contains no probe selection, no intensity adjustment on fragment length and GC content; and no intensity adjustment on the reference mean. Stage 2: Stage 1 plus probe selection. Stage 3: Stage 2 plus intensity adjustment on the fragment length and GC content and intensity adjustment on the reference mean. Stage 4: Stage 3 plus kernel smoothing with a 100 kb window. Stage 5: Stage 4 plus genome partitioning using the regression tree. This figure should be viewed in conjunction with Table 2 which summarizes the area under the ROC curves.
Figure 4
Figure 4
These nine panels show comparisons among CARAT, dCHIP and CNAG qPCR results of 69 autosomal SNPs from the human breast cancer cell line SK-BR-3. In each scatter plot the x-axis is the copy number derived from QPCR and the y-axis is the copy number derived from one of the three algorithms. ΔCt denotes the difference between the normal DNA sample versus SK-BR-3. The threshold cycle (Ct) is the cycle number at which the reporter fluorescence passes a fixed threshold above baseline. A positive ΔCt suggests an amplification while a negative ΔCt suggests a deletion. The copy number of SK-BR-3 based on QPCR is inferred as 2(ΔCt + 1). The red points are the 55 SNPs that were included in the CNAG analysis; the black points are the 14 additional SNPs that were included in dCHIP and CARAT analysis but were excluded from CNAG. Correlations are calculated for each of these two different SNP sets. The blue line in each panel represents the Y = X line. Panels (a), (b), and (c) compare single point analysis across the three methods; panels (d), (e), and (f) compare smoothing across neighboring points; panels (g), (h), and (i) compare genome partitioning across the three methods.
Figure 5
Figure 5
Three human breast cancer cell lines are represented by panels a-b (SK-BR-3), panels c-d (MCF-7), and panels e-f (ZR-75-30). The X-axis in all six panels is the physical position of SNPs along chromosome 17. The vertical lines just above the X-axis of each panel represent heterozygous (green) and homozygous (red) genotype calls. The Y-axis in all six panels is the estimated copy number. The points are derived from the kernel smoothing step and the solid horizontal lines are derived from the regression tree. Black colored lines indicate total copy number, the blue colored lines indicate the allele with the higher copy number estimate and the purple colored lines indicate the allele with the lower copy estimate. The vertical black line proximal to 40 Mb indicates the location of the HER2/neu gene. The panels on the left (panels a, c, and e) show an enlarged view of the genomic region harboring HER2/neu while the panels on the right (panels b, d, and f) show a larger view of the chromosome.
Figure 6
Figure 6
DNA sequencing traces surrounding the polymorphic nucleotide are shown in each panel. The SNP corresponds to the underlined base. Panel a and d represent tracings using the forward sequencing primer for SNP 1693987. Panels b and e represent tracings using the forward sequencing primer for SNP 1718017 while panels c and f represent tracings using the reverse sequencing primer for SNP 1718017.
Figure 7
Figure 7
The CARAT algorithm is summarized as a flow chart, indicating the major steps in both the training set and the test set. "CN" refers to copy number. The black dotted line indicates how and where the information from the training set is used in the test set.

Similar articles

Cited by

References

    1. Sebat J, Lakshmi B, Troge J, Alexander J, Young J, Lundin P, Maner S, Massa H, Walker M, Chi M, Navin N, Lucito R, Healy J, Hicks J, Ye K, Reiner A, Gilliam TC, Trask B, Patterson N, Zetterberg A, Wigler M. Large-scale copy number polymorphism in the human genome. Science. 2004;305:525–528. doi: 10.1126/science.1098918. - DOI - PubMed
    1. Iafrate AJ, Feuk L, Rivera MN, Listewnik ML, Donahoe PK, Qi Y, Scherer SW, Lee C. Detection of large-scale variation in the human genome. Nat Genet. 2004;36:949–951. doi: 10.1038/ng1416. - DOI - PubMed
    1. Sharp AJ, Locke DP, McGrath SD, Cheng Z, Bailey JA, Vallente RU, Pertz LM, Clark RA, Schwartz S, Segraves R, Oseroff VV, Albertson DG, Pinkel D, Eichler EE. Segmental duplications and copy-number variation in the human genome. Am J Hum Genet. 2005;77:78–88. doi: 10.1086/431652. - DOI - PMC - PubMed
    1. Tuzun E, Sharp AJ, Bailey JA, Kaul R, Morrison VA, Pertz LM, Haugen E, Hayden H, Albertson D, Pinkel D, Olson MV, Eichler EE. Fine-scale structural variation of the human genome. Nat Genet. 2005;37:727–732. doi: 10.1038/ng1562. - DOI - PubMed
    1. Feuk L, Carson AR, Scherer SW. Structural variation in the human genome. Nat Rev Genet. 2006;7:85–97. doi: 10.1038/nrg1767. - DOI - PubMed

MeSH terms

LinkOut - more resources