

Sexual dimorphism in immune response genes as a function of puberty
- PMID: 16504066
- PMCID: PMC1402325
- DOI: 10.1186/1471-2172-7-2
Sexual dimorphism in immune response genes as a function of puberty
Abstract
Background: Autoimmune diseases are more prevalent in females than in males, whereas males have higher mortality associated with infectious diseases. To increase our understanding of this sexual dimorphism in the immune system, we sought to identify and characterize inherent differences in immune response programs in the spleens of male and female mice before, during and after puberty.
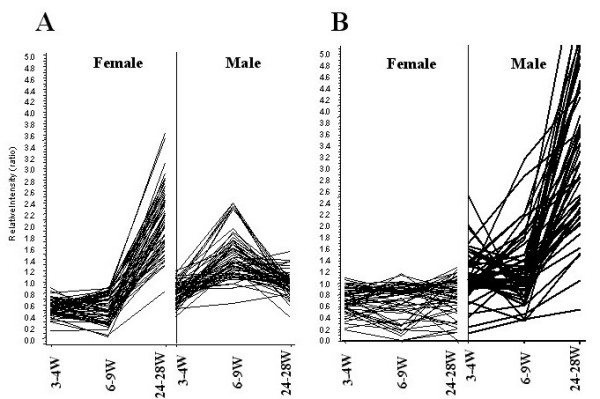
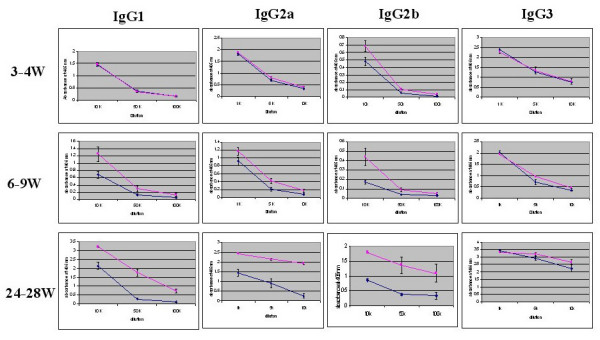
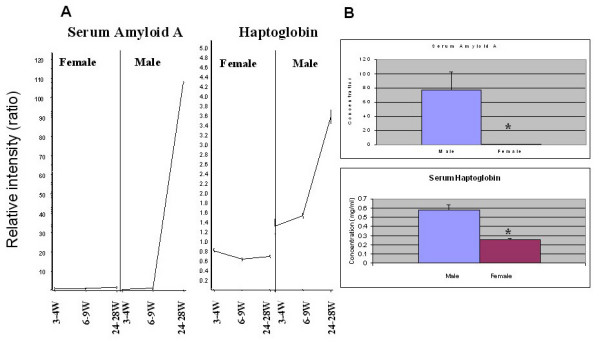
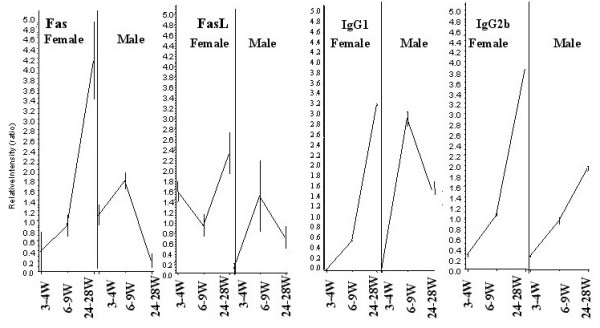
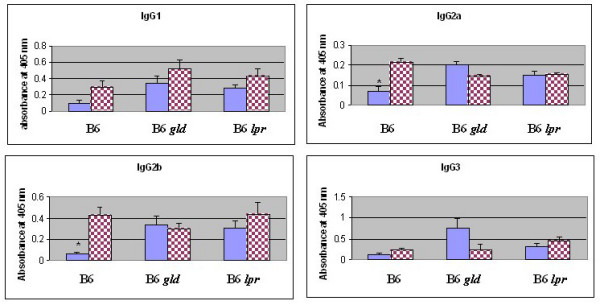
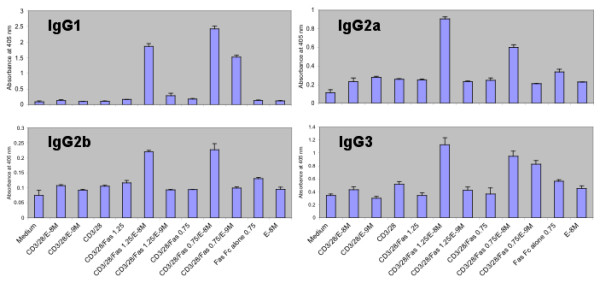
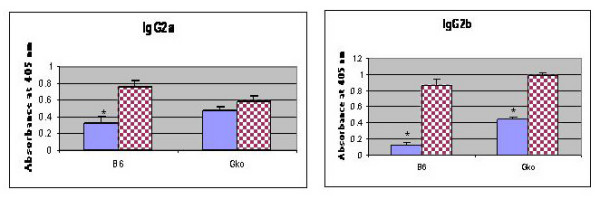
Results: After the onset of puberty, female mice showed a higher expression of adaptive immune response genes, while males had a higher expression of innate immune genes. This result suggested a requirement for sex hormones. Using in vivo and in vitro assays in normal and mutant mouse strains, we found that reverse signaling through FasL was directly influenced by estrogen, with downstream consequences of increased CD8+ T cell-derived B cell help (via cytokines) and enhanced immunoglobulin production.
Conclusion: These results demonstrate that sexual dimorphism in innate and adaptive immune genes is dependent on puberty. This study also revealed that estrogen influences immunoglobulin levels in post-pubertal female mice via the Fas-FasL pathway.
Figures
Similar articles
-
B lymphocytes mediate Fas-dependent cytotoxicity in MRL/lpr mice.J Leukoc Biol. 2005 Nov;78(5):1052-9. doi: 10.1189/jlb.0904536. Epub 2005 Oct 4. J Leukoc Biol. 2005. PMID: 16204618
-
Differential expression of Fas and Fas ligand in acute and chronic graft-versus-host disease: up-regulation of Fas and Fas ligand requires CD8+ T cell activation and IFN-gamma production.J Immunol. 1998 Sep 15;161(6):2848-55. J Immunol. 1998. PMID: 9743345
-
Constitutive activation of the aryl hydrocarbon receptor in T-lineage cells induces thymus involution independently of the Fas/Fas ligand signaling pathway.Int Immunopharmacol. 2006 Feb;6(2):279-86. doi: 10.1016/j.intimp.2005.08.015. Epub 2005 Sep 8. Int Immunopharmacol. 2006. PMID: 16399633
-
The role of Fas/FasL interactions in the regulation of B cell function.Behring Inst Mitt. 1996 Oct;(97):185-99. Behring Inst Mitt. 1996. PMID: 8950476 Review.
-
Sexual Dimorphism in Innate Immunity.Clin Rev Allergy Immunol. 2019 Jun;56(3):308-321. doi: 10.1007/s12016-017-8648-x. Clin Rev Allergy Immunol. 2019. PMID: 28963611 Review.
Cited by
-
The role of sex hormones in the development of Th2 immunity in a gender-biased model of Trichuris muris infection.Eur J Immunol. 2010 Feb;40(2):406-16. doi: 10.1002/eji.200939589. Eur J Immunol. 2010. PMID: 19950176 Free PMC article.
-
The role of the innate and adaptive immune system in pediatric inflammatory bowel disease.Inflamm Bowel Dis. 2013 Aug;19(9):2011-20. doi: 10.1097/MIB.0b013e318281f590. Inflamm Bowel Dis. 2013. PMID: 23702804 Free PMC article. Review.
-
Sex hormones impact early maturation and immune response in the arteriovenous fistula mouse model.Am J Physiol Heart Circ Physiol. 2023 Jul 1;325(1):H77-H88. doi: 10.1152/ajpheart.00049.2023. Epub 2023 May 5. Am J Physiol Heart Circ Physiol. 2023. PMID: 37145957 Free PMC article.
-
Characterising Pre-pubertal Resistance to Death from Endotoxemia.Sci Rep. 2017 Nov 29;7(1):16541. doi: 10.1038/s41598-017-16743-1. Sci Rep. 2017. PMID: 29185479 Free PMC article.
-
Complement Dependent Synaptic Reorganisation During Critical Periods of Brain Development and Risk for Psychiatric Disorder.Front Neurosci. 2022 May 6;16:840266. doi: 10.3389/fnins.2022.840266. eCollection 2022. Front Neurosci. 2022. PMID: 35600620 Free PMC article. Review.
References
-
- Wizemann T. Sex begins in the womb. In: Exploring the Biological Contributions to Human Health: Does Sex Matter? Report of the Institute of Medicine. Edited by Wizemann, T and Pardue M-L. Washington, DC. National Academy. 2001. pp. 37–62. - PubMed
-
- Alexander J, Stimson WH. Sex-Hormones and the Course of Parasitic Infection. Parasitology Today. 1988;4:189–193. doi: 10.1016/0169-4758(88)90077-4. - DOI
Publication types
MeSH terms
Substances
Grants and funding
LinkOut - more resources
Full Text Sources
Molecular Biology Databases
Research Materials
Miscellaneous
