Comparative Study
. 2006 Feb 22:7:32.
doi: 10.1186/1471-2164-7-32.

Common features and interesting differences in transcriptional responses to secretion stress in the fungi Trichoderma reesei and Saccharomyces cerevisiae

Affiliations
Comparative Study

Common features and interesting differences in transcriptional responses to secretion stress in the fungi Trichoderma reesei and Saccharomyces cerevisiae

Mikko Arvas et al. BMC Genomics. .

Abstract

Background: Secretion stress is caused by compromised folding, modification or transport of proteins in the secretory pathway. In fungi, induction of genes in response to secretion stress is mediated mainly by the unfolded protein response (UPR) pathway. This study aims at uncovering transcriptional responses occurring in the filamentous fungi Trichoderma reesei exposed to secretion stress and comparing these to those found in the yeast Saccharomyces cerevisiae.

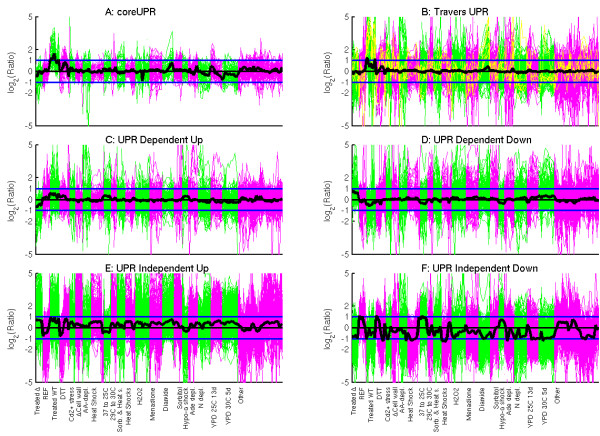
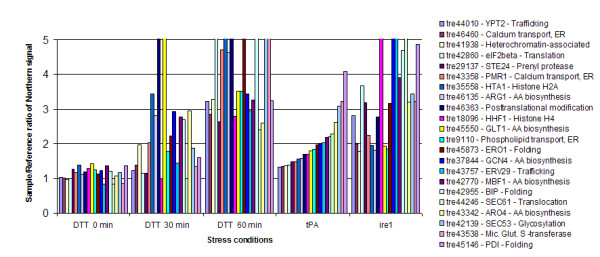
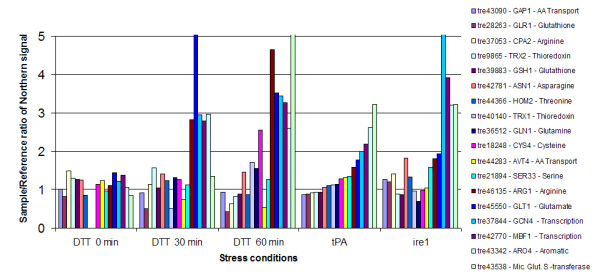
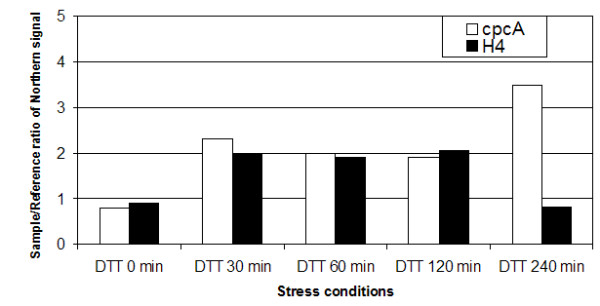
Results: Chemostat cultures of T. reesei expressing human tissue plasminogen activator (tPA) and batch bioreactor cultures treated with dithiothreitol (DTT) to prevent correct protein folding were analysed with cDNA subtraction and cDNA-amplified fragment length polymorphism (AFLP) experiments. ESTs corresponding to 457 unique genes putatively induced under secretion stress were isolated and the expression pattern of 60 genes was confirmed by Northern analysis. Expression of these genes was also studied in a strain over-expressing inositol-requiring enzyme 1 (IREI) protein, a sensor for the UPR pathway. To compare the data with that of S. cerevisiae, published transcriptome profiling data on various stress responses in S. cerevisiae was reanalysed. The genes up-regulated in response to secretion stress included a large number of secretion related genes in both organisms. In addition, analysis of T. reesei revealed up regulation of the cpc1 transcription factor gene and nucleosomal genes. The induction of the cpcA and histone gene H4 were shown to be induced also in cultures of Aspergillus nidulans treated with DTT.

Conclusion: Analysis of the genes induced under secretion stress has revealed novel features in the stress response in T. reesei and in filamentous fungi. We have demonstrated that in addition to the previously rather well characterised induction of genes for many ER proteins or secretion related proteins also other types of responses exist.


Figures

Figure 1
Figure 1
Expression of secretion stress related genes of S. cerevisiae under different stress conditions. Expression values of the genes (shown as log2 of the expression level ratio in stress vs. reference conditions) from 174 different stress conditions were collected from published articles. The expression level values of individual genes are shown in purpleor greenand the median of the gene group in blackand the standard deviation of the whole experiment in blue. A: "coreUPR", genes showing significant up regulation in "Treated WT" experiment set against both the "Treated ρ" and "REF" experiment sets. B: "Travers UPR", genes defined as UPR genes and genes defined as UPR model genes in yellowby [2]. C: "UPR Dependent Up", genes showing significant up regulation only in "Treated WT" set against "Treated ρ" set. D: "UPR Dependent Down", genes showing significant down regulation only in "Treated WT" against "Treated ρ" set. E: "UPR Independent Up", genes showing significant up regulation only in "Treated WT" against "REF" set. F: "UPR Independent Down", genes showing significant down regulation only in "Treated WT" against "REF" set. The stress conditions were divided in sets as follows: Treated ρ IRE1 and HAC1 deletion strains treated with DTT or tunicamycin, used as UPR dependent reference set in this study [2, 3]; REF reference set, used as UPR independent reference in this study [17, 18]; Treated WT cultures treated with DTT or tunicamycin or recombinant strains producing a secreted heterologous protein, used as UPR conditions in this study [2, 3, 17-19, 69]; DTT DTT treatment, 4 h time series [17]; Cd2+ stress Cd2+ treatment, 2 h time series and met4 deletion [48]; ρCell Wall strains deleted in cell wall genes [49]; AA-depl. methyl methanesulfonate, 3-aminotriazole and amino acid depletion treatments and GCN4 constitutive and GCN4 deletion strains [35]; Heat Shock 1 h time series after heat shock from 25°C to 37°C, [17]; 37 to 25 1, 5 h time series after temperature shift from 37°C to 25°C, [17]; 29C to 33C 1, 5 h time series after mild heat shock of 29°C to 33°C [17]; Sorbi. & Heat S. mild heat shock with different osmolarities, like previous but with sorbitol treatments [17]; Heat Shocks different heat shocks [17]; H202 2 h time series after hydrogen peroxide treatment [17]; Menadione 2 h time series after menadione treatment [17]; Diamide 1, 5 h time series after diamide treatment [17]; Sorbitol 2 h time series after hyper-osmotic shock with sorbitol [17]; Hypo-o shock 1 h time series after hypo-osmotic shock with sorbitol [17]; Ade. depl. 6 h time series after amino acid and adenine depletion [17]; N depl. 3 d time series after nitrogen depletion [17]; YPD 25C 13 d 13 d time series of growth on YPD at 25°C [17]; YPD 30C 5 d 5 d time series of growth on YPD at 30°C [17]; Other other conditions [17].
Figure 2
Figure 2
Northern analysis of selected T. reesei genes revealed by the cDNA subtraction library and cDNA-AFLP analysis. The expression level of the genes was analysed in cultures treated with DTT for 0, 30 and 60 min and in untreated reference cultures, in chemostat cultures of a tPA producing strain and its parental strain, and in a strain overexpressing ire1 and in its parental strain. The signals of the specific mRNAs were quantified and normalised using the signals of gpd1. The ratio of the signal in the analysed sample vs. the signal in a corresponding reference culture are shown for genes showing UPR-like gene expression. T. reesei protein model identifier (genome version 1.2), likely S. cerevisiae homologue and function or process in which the gene is involved is indicated after gene name. DTT 0 min, DTT treatment 0 min; DTT 30 min, DTT treatment 30 min; DTT 60 min, DTT treatment for 60 min; tPA, tPA producing chemostat culture; ire1, ire1 overexpressing strain.
Figure 3
Figure 3
Northern analysis of genes related to amino acid biosynthesis and glutathione metabolism in T. reesei. The expression level of the genes was analysed in bioreactor cultures treated with DTT for 0, 30 and 60 min and in untreated reference cultures, in chemostat cultures of a tPA producing strain and its parental strain, and in a strain overexpressing ire1 and in its parental strain. The signals of the specific mRNAs were quantified and normalised using the signals of gpd1. The ratio of the signal in the analysed sample vs. the signal in a corresponding reference culture are shown. T. reesei protein model identifier (genome version 1.2), likely S. cerevisiae homologue and amino acid for whose biosynthesis or use the gene is involved is indicated after the gene name. DTT 0 min, DTT treatment 0 min; DTT 30 min, DTT treatment 30 min; DTT 60 min, DTT treatment for 60 min; tPA, tPA producing chemostat culture; ire1, ire1 overexpressing strain, AA transport, amino acid transport.
Figure 4
Figure 4
Northern analysis of A. nidulans cpcA and histone H4 genes in a culture treated with DTT and in an untreated reference culture. The expression level of the genes was analysed in a culture treated with DTT for 0, 30, 60, 120 and 240 min and in untreated reference culture. The signals of the specific mRNAs were quantified and normalised using the signals of gpd1. The ratio of the signal in the analysed sample vs. the signal in a corresponding reference culture are shown. cpcA [70], H4 [30].
Figure 5
Figure 5
Expression of S. cerevisiae amino acid biosynthesis genes controlled by GCN4 in response to amino acid deprivation from [35] in 174 different stress experiments assembled from various articles. The expression levels are shown as log2 of signal ratios stressed/reference cultures in 174 different stress experiments assembled from various articles [2, 3, 17, 18, 35, 48, 49]. The expression values of individual genes as purpleand greenstriped lines, the median of gene group in black, standard deviation of the whole experiment in blue. Experiment sets are explained in Fig 1.

References

    1. Cox JS, Walter P. A novel mechanism for regulating activity of a transcription factor that controls the unfolded protein response. Cell. 1996;87:391–404. doi: 10.1016/S0092-8674(00)81360-4. - DOI - PubMed
    1. Travers KJ, Patil CK, Wodicka L, Lockhart DJ, Weissman JS, Walter PURBWSNSS. Functional and Genomic Analyses Reveal an Essential Coordination between the Unfolded Protein Response and ER-Associated Degradation. Cell. 2000;101:249–258. doi: 10.1016/S0092-8674(00)80835-1. - DOI - PubMed
    1. Patil CK, Li H, Walter P. Gcn4p and novel upstream activating sequences regulate targets of the unfolded protein response. PLoS Biol. 2004;2:E246. doi: 10.1371/journal.pbio.0020246. - DOI - PMC - PubMed
    1. Valkonen M, Penttila M, Saloheimo M. Effects of inactivation and constitutive expression of the unfolded- protein response pathway on protein production in the yeast Saccharomyces cerevisiae. Appl Environ Microbiol. 2003;69:2065–2072. doi: 10.1128/AEM.69.4.2065-2072.2003. - DOI - PMC - PubMed
    1. Saloheimo M, Valkonen M, Penttila M. Activation mechanisms of the HAC1-mediated unfolded protein response in filamentous fungi. Mol Microbiol. 2003;47:1149–1161. doi: 10.1046/j.1365-2958.2003.03363.x. - DOI - PubMed

Publication types

MeSH terms

LinkOut - more resources