. 2006 Feb 23:7:90.
doi: 10.1186/1471-2105-7-90.

A graphical model approach to automated classification of protein subcellular location patterns in multi-cell images

Affiliations

A graphical model approach to automated classification of protein subcellular location patterns in multi-cell images

Shann-Ching Chen et al. BMC Bioinformatics. .

Abstract

Background: Knowledge of the subcellular location of a protein is critical to understanding how that protein works in a cell. This location is frequently determined by the interpretation of fluorescence microscope images. In recent years, automated systems have been developed for consistent and objective interpretation of such images so that the protein pattern in a single cell can be assigned to a known location category. While these systems perform with nearly perfect accuracy for single cell images of all major subcellular structures, their ability to distinguish subpatterns of an organelle (such as two Golgi proteins) is not perfect. Our goal in the work described here was to improve the ability of an automated system to decide which of two similar patterns is present in a field of cells by considering more than one cell at a time. Since cells displaying the same location pattern are often clustered together, considering multiple cells may be expected to improve discrimination between similar patterns.

Results: We describe how to take advantage of information on experimental conditions to construct a graphical representation for multiple cells in a field. Assuming that a field is composed of a small number of classes, the classification accuracy can be improved by allowing the computed probability of each pattern for each cell to be influenced by the probabilities of its neighboring cells in the model. We describe a novel way to allow this influence to occur, in which we adjust the prior probabilities of each class to reflect the patterns that are present. When this graphical model approach is used on synthetic multi-cell images in which the true class of each cell is known, we observe that the ability to distinguish similar classes is improved without suffering any degradation in ability to distinguish dissimilar classes. The computational complexity of the method is sufficiently low that improved assignments of classes can be obtained for fields of twelve cells in under 0.04 second on a 1600 megahertz processor.

Conclusion: We demonstrate that graphical models can be used to improve the accuracy of classification of subcellular patterns in multi-cell fluorescence microscope images. We also describe a novel algorithm for inferring classes from a graphical model. The performance and speed suggest that the method will be particularly valuable for analysis of images from high-throughput microscopy. We also anticipate that it will be useful for analyzing the mixtures of cell types typically present in images of tissues. Lastly, we anticipate that the method can be generalized to other problems.


Figures

Figure 1
Figure 1
Illustration of classification approaches to single cells. A) Basic approach to feature-based classification of single cell images. B) Majority-voting classifier.
Figure 2
Figure 2
Classification Accuracy for simulated fields of cells using the equal-sized class model. Simulated fields consisting of N1 cells from one class and N2 cells from a different class were generated as described in the text, with N1 + N2 = 12. A) The average accuracy across all N1 values are shown for the equal-sized class model (○) as a function of the model parameter β. The accuracy of the base single cell classifier is shown by the dashed line. The best accuracy (90.4%) of the equal-sized class model is obtained when β = -0.4. B) The improvement in average classification accuracy over the base single cell classifier is shown as a function of N1. Each point shows the average classification accuracy over 10 repeated trials for 12 cells for all possible pairs of classes for β = -0.4. The average accuracy of the equal-sized class model (○) and base classifier (□) are shown. The classification accuracy is better than that of the base classifier only when N1 = 0, the case when the set consists of just one class.
Figure 3
Figure 3
The prior updating algorithm. A) Pseudo-code for the algorithm is shown. A free parameter α in the updating equation is used to determine the degree of change of priors. When α is zero, the priors do not change and the graphical model results are the same as the results of the base classifier. The priors are pushed harder to the majority classes in the field as α increases. B) Illustration of the PU algorithm for a graphical network of seven cells and three classes.
Figure 4
Figure 4
Improvement of classification accuracy using feature space graphical model. Each point shows the average classification accuracy over 10 repeated trials for 12 cells for fields of six cells each from two classes. The average accuracy for pairs of similar classes (○), dissimilar classes by (□), and all classes (△) are shown. The best accuracies are obtained with α = 0.15 and dcutoff = 8. The accuracy of similar classes is improved by 9% (from 82.2% to 91.3%), while the accuracy of dissimilar classes is also improved 3% (from 95.3% to 98.5%). The overall accuracy is improved by the prior updating method by over 5%(from 90.1% to 95.7%).
Figure 5
Figure 5
Improvement in classification accuracy for simulated fields of cells using a feature space graphical model. Simulated fields consisting of N1 cells from one class and N2 cells from a different class were generated as described in the text. A class label was assigned to each cell in the simulation using the feature space graphical model described in the text. The improvement in average classification accuracy over the base single cell classifier is shown as a function of N1, where N1+N2 = 12. Each point shows the average classification accuracy over 10 repeated trials for 12 cells for all possible pairs of classes. The average accuracy for pairs of similar classes (○), dissimilar classes by (□), and all classes (△) are shown. Results except for N1 = 0 are for a dcutoff value of 8, the best value of those tested.
Figure 6
Figure 6
Improvement in classification accuracy for simulated fields of cells using a physical space graphical model. Simulated fields containing clones of cells consisting of N1 cells from one class and N2 cells from a different class were created as described in the text for various values of D, the distance between the initial cells of each class. A class label was assigned to each cell in the simulation using the physical space graphical model described in the text. The improvement in average classification accuracy over the base single cell classifier is shown as a function of N1, where N1+N2 = 12. Each point shows the average classification accuracy over 10 repeated trials for 12 cells for all possible pairs of classes for fields generated with D = 0 (○), D = 6 (□), D = 12 (△), and D = 400 (◇). Results except for N1 = 0 are for a dcutoff value of 6, the best value of those tested. Note that, as expected, the accuracy improves with increasing D.
Figure 7
Figure 7
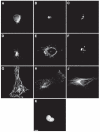
Typical images from the 2-D HeLa cell image collection used in this study. Images are shown for cells labelled with antibodies against an ER protein (A), the Golgi protein giantin (B), the Golgi protein GPP130 (C), the lysosomal protein LAMP2 (D), a mitochondrial protein (E), the nucleolar protein nucleolin (F), transferring receptor (H), and the cytoskeletal protein tubulin (J). Images are also shown for filamentous actin labelled with rhodamine-phalloidin (G) and DNA labelled with DAPI (K). Scale bar = 10 μm. From [6].
Figure 8
Figure 8
Algorithm for simulating cell fields. The algorithm simulates the formation of a clone of N cells from a single cell and incorporates cell growth and movement. u[d,d] represents a two dimensional uniform distribution from -d to d (e.g., a cell can move to anywhere within the square with length of the side equals to 2d). d1 and d2 describe how much cells spread apart after cell division. td corresponds to the average generation time of tg, and tm indicates the average time a cell moves. If the d1 and d2 are the same, large td and small tm will result a more compact colony, while small td and large tm will result a sparser colony.
Figure 9
Figure 9
Simulation of cell positions for two classes. Two simulated clones from different classes were generated with a separation parameter D defining the distance between the initial cell positions. An example of the distribution for two simulated clones of six cells each is shown for D = 12. Edges connect cells that are less than 6 units apart. Note that some of these edges connect cells from different classes.

References

    1. Park KJ, Kanehisa M. Prediction of protein subcellular locations by support vector machines using compositions of amino acids and amino acid pairs. Bioinformatics. 2003;19:1656–1663. - PubMed
    1. Chou KC, Cai YD. Prediction and classification of protein subcellular location-sequence-order effect and pseudo amino acid composition. J Cell Biochem. 2003;90:1250–1260. - PubMed
    1. Lu Z, Szafron D, Greiner R, Lu P, Wishart DS, Poulin B, Anvik J, Macdonell C, Eisner R. Predicting subcellular localization of proteins using machine-learned classifiers. Bioinformatics. 2004;20:547–556. - PubMed
    1. Boland MV, Markey MK, Murphy RF. Automated recognition of patterns characteristic of subcellular structures in fluorescence microscopy images. Cytometry. 1998;33:366–375. - PubMed
    1. Murphy RF, Boland MV, Velliste M. Towards a Systematics for Protein Subcellular Location: Quantitative Description of Protein Localization Patterns and Automated Analysis of Fluorescence Microscope Images. Proc Int Conf Intell Syst Mol Biol. 2000;8:251–259. - PubMed

Publication types

LinkOut - more resources