

A transcriptome anatomy of human colorectal cancers
- PMID: 16504081
- PMCID: PMC1402307
- DOI: 10.1186/1471-2407-6-40
A transcriptome anatomy of human colorectal cancers
Abstract
Background: Accumulating databases in human genome research have enabled integrated genome-wide study on complicated diseases such as cancers. A practical approach is to mine a global transcriptome profile of disease from public database. New concepts of these diseases might emerge by landscaping this profile.
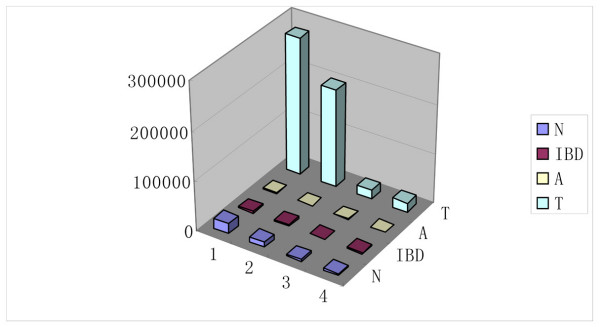
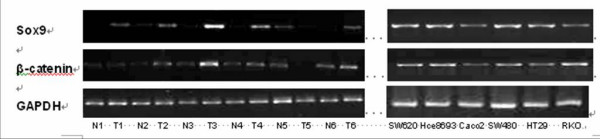
Methods: In this study, we clustered human colorectal normal mucosa (N), inflammatory bowel disease (IBD), adenoma (A) and cancer (T) related expression sequence tags (EST) into UniGenes via an in-house GetUni software package and analyzed the transcriptome overview of these libraries by GOTree Machine (GOTM). Additionally, we downloaded UniGene based cDNA libraries of colon and analyzed them by Xprofiler to cross validate the efficiency of GetUni. Semi-quantitative RT-PCR was used to validate the expression of beta-catenin and. 7 novel genes in colorectal cancers.
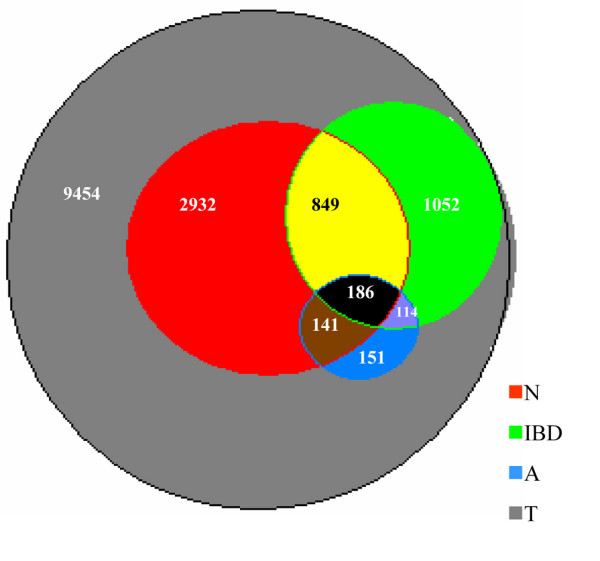
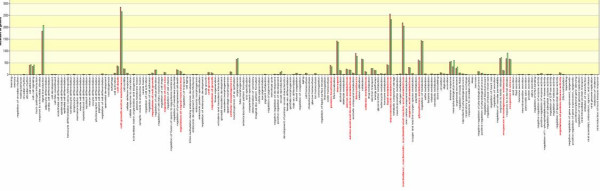
Results: The efficiency of GetUni was successfully validated by Xprofiler and RT-PCR. Genes in library N, IBD and A were all found in library T. A total of 14,879 genes were identified with 2,355 of them having at least 2 transcripts. Differences in gene enrichment among these libraries were statistically significant in 50 signal transduction pathways and Pfam protein domains by GOTM analysis P < 0.01 Hypergeometric Test). Genes in two metabolic pathways, ribosome and glycolysis, were more enriched in the expression profiles of A and IBD than in N and T. Seven transmembrane receptor superfamily genes were typically abundant in cancers.
Conclusion: Colorectal cancers are genetically heterogeneous. Transcription variants are common in them. Aberrations of ribosome and glycolysis pathway might be early indicators of precursor lesions in colon cancers. The electronic gene expression profile could be used to highlight the integral molecular events in colorectal cancers.
Figures
Similar articles
-
[Bioinformatic analysis of adenoma-normal mucosa SSH library of colon].Yi Chuan. 2006 Apr;28(4):385-92. Yi Chuan. 2006. PMID: 16606587 Chinese.
-
ITF2 prevents activation of the β-catenin-TCF4 complex in colon cancer cells and levels decrease with tumor progression.Gastroenterology. 2014 Aug;147(2):430-442.e8. doi: 10.1053/j.gastro.2014.04.047. Epub 2014 May 15. Gastroenterology. 2014. PMID: 24846398
-
Expression of Wnt and Notch signaling pathways in inflammatory bowel disease treated with mesenchymal stem cell transplantation: evaluation in a rat model.Stem Cell Res Ther. 2015 May 22;6(1):101. doi: 10.1186/s13287-015-0092-3. Stem Cell Res Ther. 2015. PMID: 25998108 Free PMC article.
-
Role of glycolysis in inflammatory bowel disease and its associated colorectal cancer.Front Endocrinol (Lausanne). 2023 Oct 10;14:1242991. doi: 10.3389/fendo.2023.1242991. eCollection 2023. Front Endocrinol (Lausanne). 2023. PMID: 37881499 Free PMC article. Review.
-
The maturing of the human embryonic stem cell transcriptome profile.Trends Biotechnol. 2004 Dec;22(12):609-12. doi: 10.1016/j.tibtech.2004.10.001. Trends Biotechnol. 2004. PMID: 15542146 Review.
Cited by
-
Oral administration of the anti-proliferative substance taurolidine has no impact on dextran sulfate sodium induced colitis-associated carcinogenesis in mice.J Carcinog. 2010 Apr 16;9:5. doi: 10.4103/1477-3163.62536. J Carcinog. 2010. PMID: 20442801 Free PMC article.
-
SOX9 Is Highly Expressed in Nonampullary Duodenal Adenoma and Adenocarcinoma in Humans.Gut Liver. 2013 Sep;7(5):513-8. doi: 10.5009/gnl.2013.7.5.513. Epub 2013 Jun 11. Gut Liver. 2013. PMID: 24073307 Free PMC article.
-
SOX9 is expressed in normal stomach, intestinal metaplasia, and gastric carcinoma in humans.J Gastroenterol. 2011 Nov;46(11):1292-9. doi: 10.1007/s00535-011-0443-5. Epub 2011 Aug 23. J Gastroenterol. 2011. PMID: 21861142
-
Distinct levels of Sox9 expression mark colon epithelial stem cells that form colonoids in culture.Am J Physiol Gastrointest Liver Physiol. 2012 Jan 1;302(1):G10-20. doi: 10.1152/ajpgi.00277.2011. Epub 2011 Oct 13. Am J Physiol Gastrointest Liver Physiol. 2012. PMID: 21995959 Free PMC article.
-
Meta-analytical biomarker search of EST expression data reveals three differentially expressed candidates.BMC Genomics. 2012;13 Suppl 7(Suppl 7):S12. doi: 10.1186/1471-2164-13-S7-S12. Epub 2012 Dec 13. BMC Genomics. 2012. PMID: 23282184 Free PMC article.
References
-
- Hamilton SR, Altonin LA. Pathology and Genetics: tumours of the Digestive System. WHO classifications Third Series. RIAS, Ryon, France; 2001.
-
- Thibodeau SN, Bren G, Schaid D. Microsatellite instability in cancer of the proximal colon. Science. 1993;260:816–819. - PubMed
Publication types
MeSH terms
Substances
LinkOut - more resources
Full Text Sources
Medical
Research Materials
