Comparative Study
. 2006 Feb 23;7(1):34.
doi: 10.1186/1465-9921-7-34.

Airway smooth muscle relaxation results from a reduction in the frequency of Ca2+ oscillations induced by a cAMP-mediated inhibition of the IP3 receptor

Affiliations
Comparative Study

Airway smooth muscle relaxation results from a reduction in the frequency of Ca2+ oscillations induced by a cAMP-mediated inhibition of the IP3 receptor

Yan Bai et al. Respir Res. .

Abstract

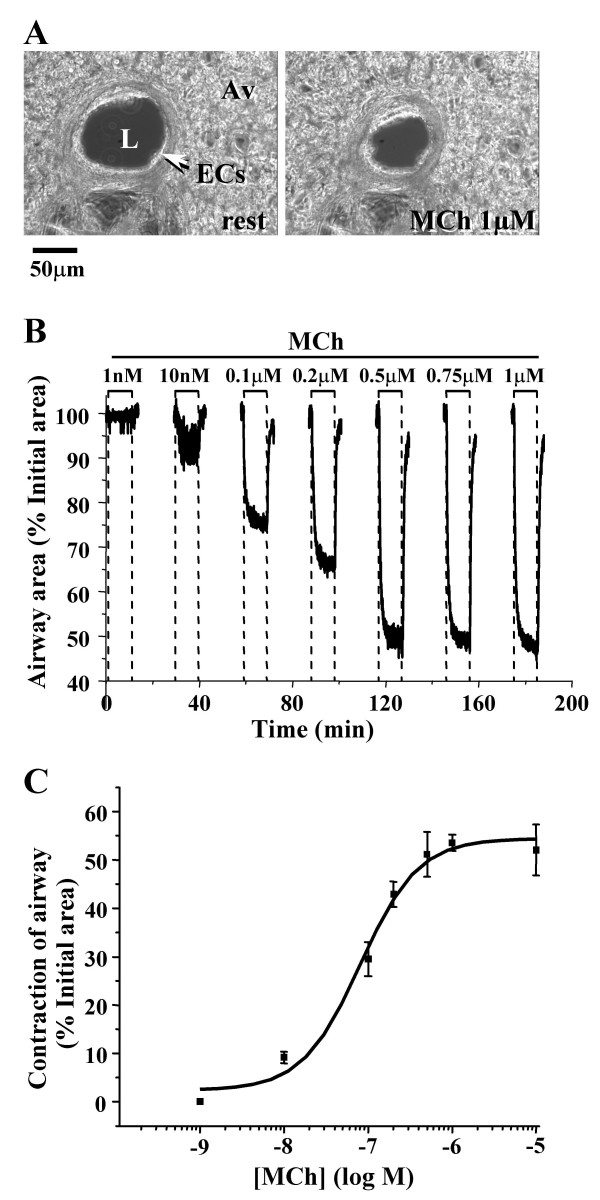
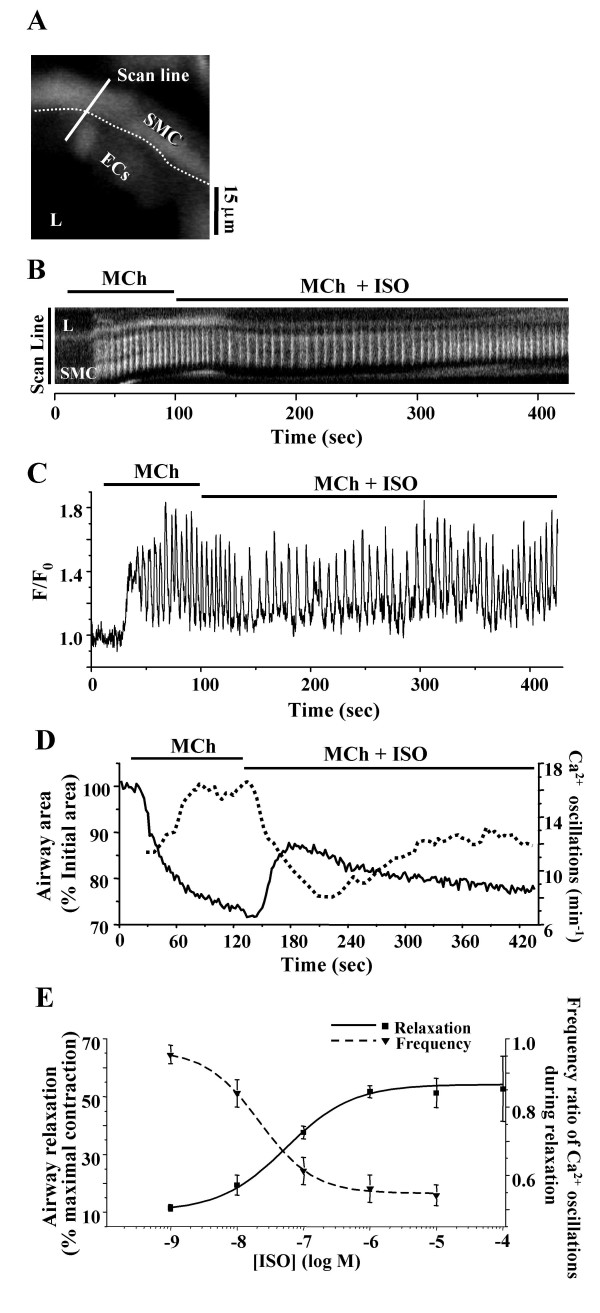
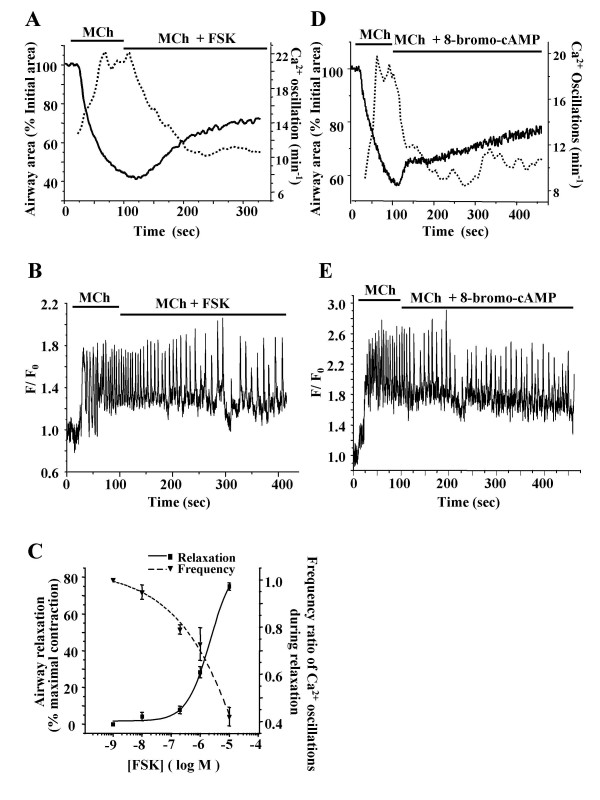
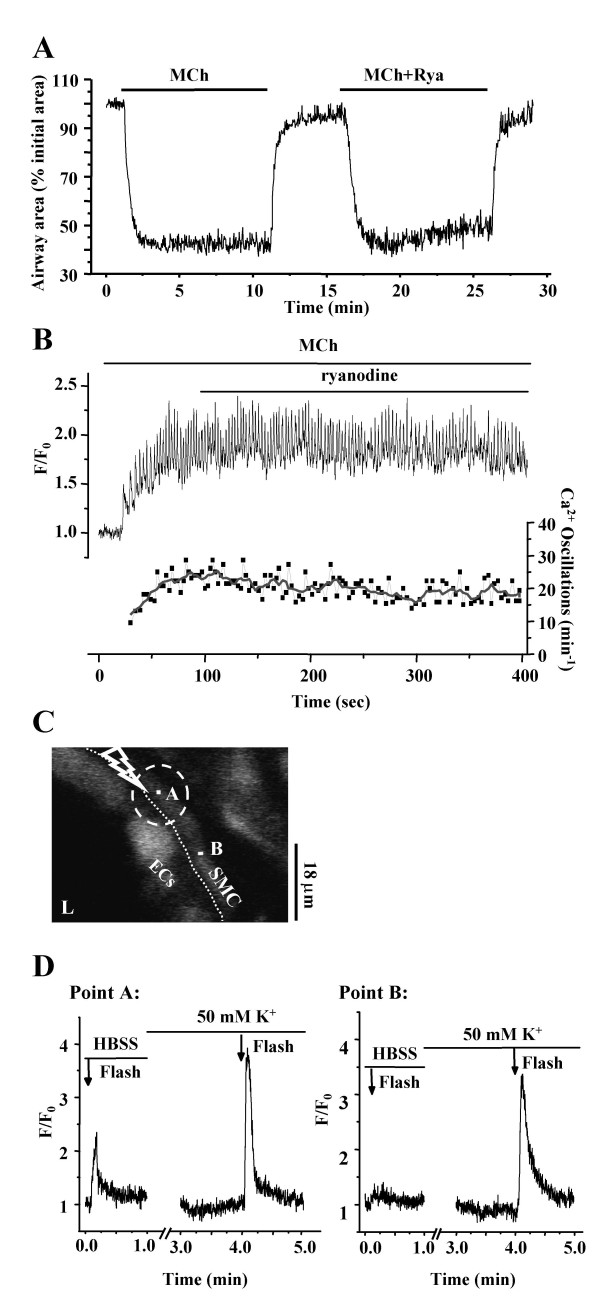
Background: It has been shown that the contractile state of airway smooth muscle cells (SMCs) in response to agonists is determined by the frequency of Ca2+ oscillations occurring within the SMCs. Therefore, we hypothesized that the relaxation of airway SMCs induced by agents that increase cAMP results from the down-regulation or slowing of the frequency of the Ca2+ oscillations.

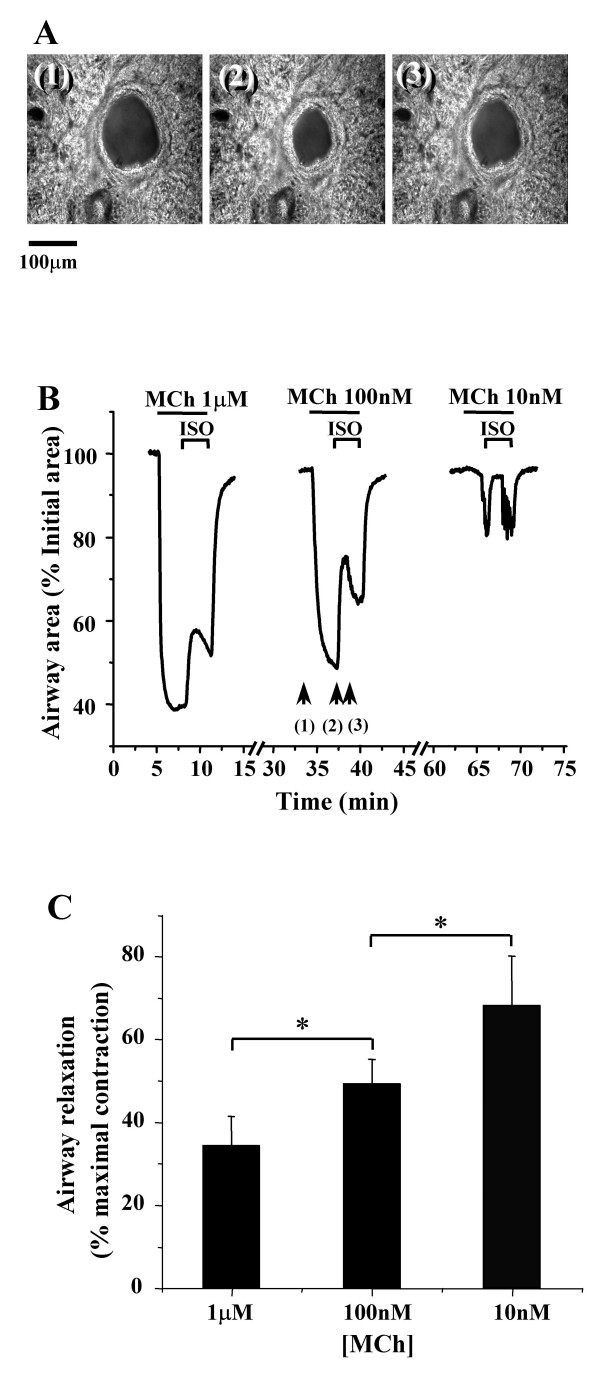
Methods: The effects of isoproterenol (ISO), forskolin (FSK) and 8-bromo-cAMP on the relaxation and Ca2+ signaling of airway SMCs contracted with methacholine (MCh) was investigated in murine lung slices with phase-contrast and laser scanning microscopy.

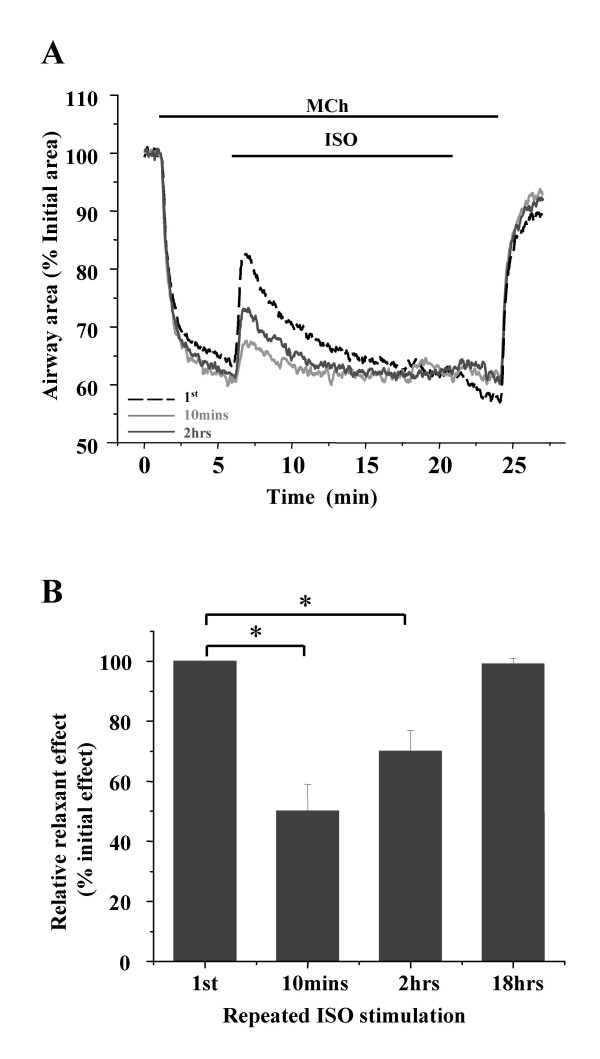
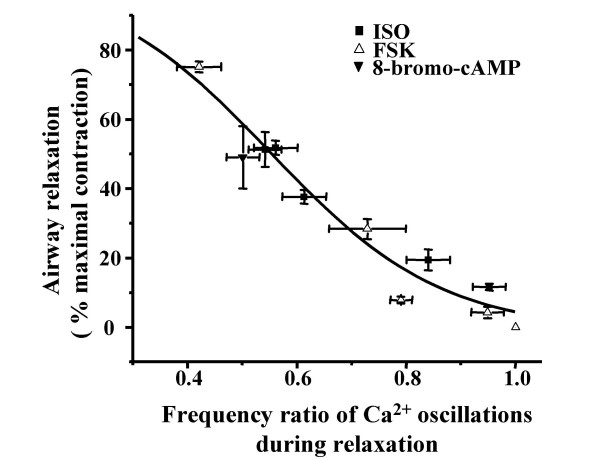
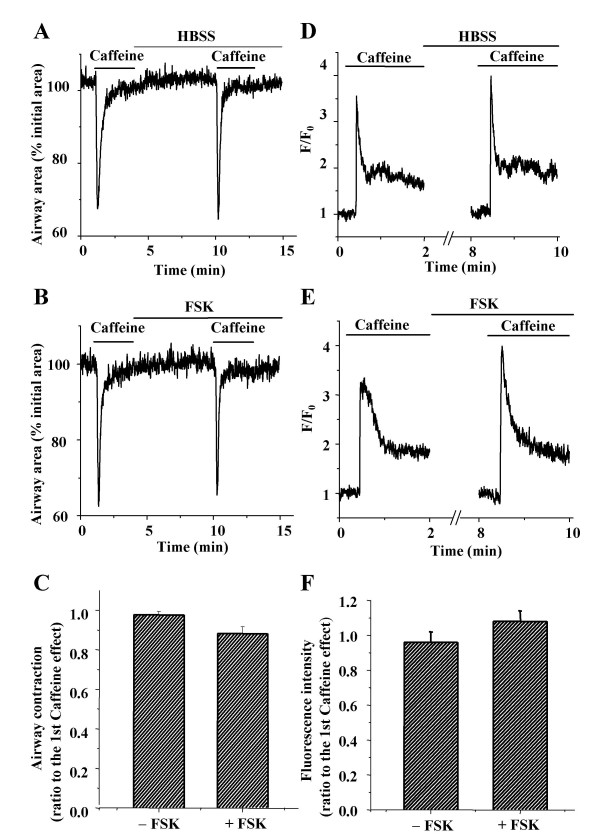
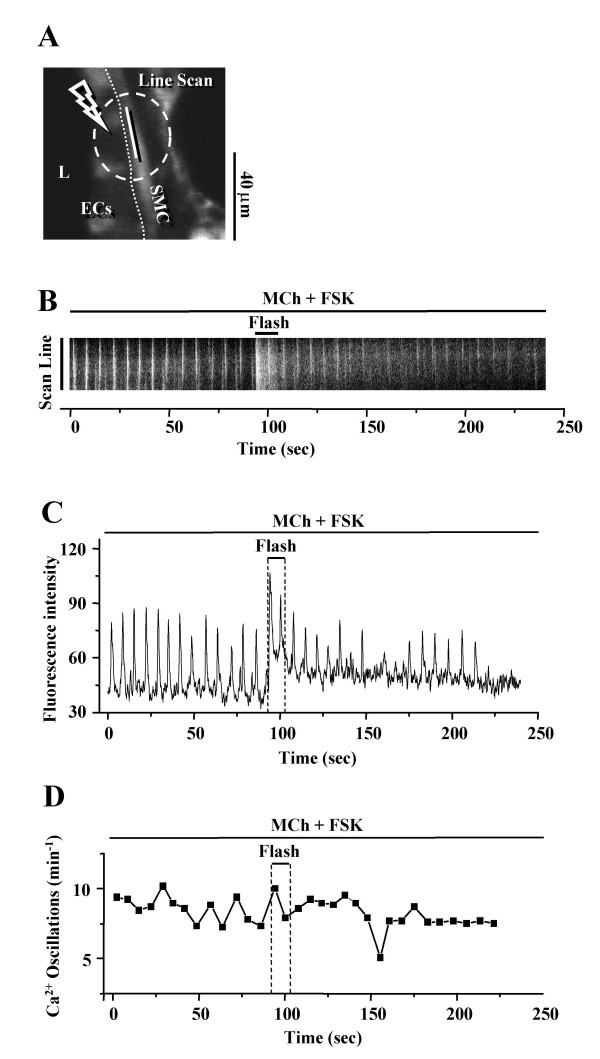
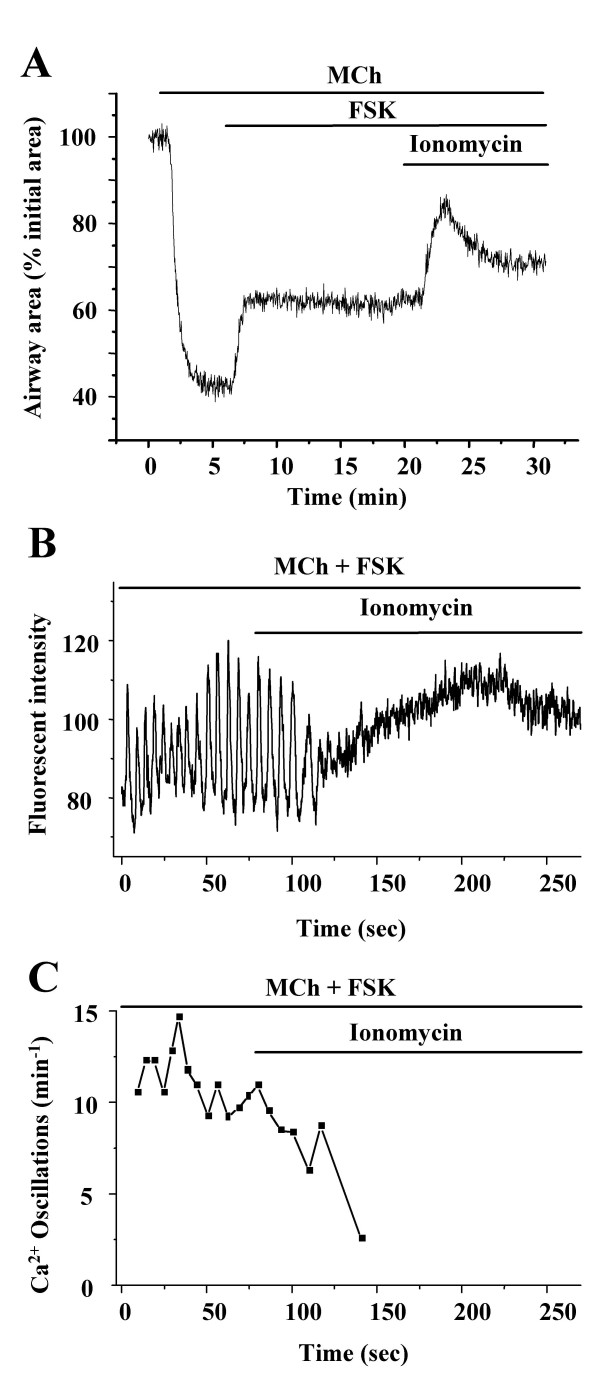
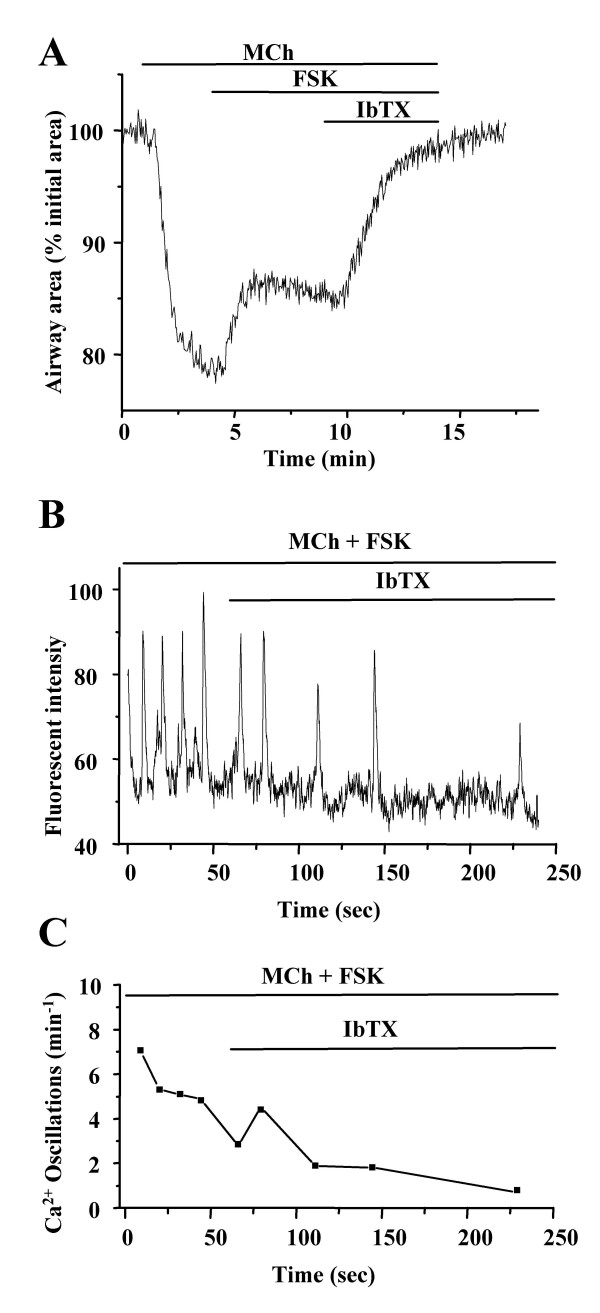
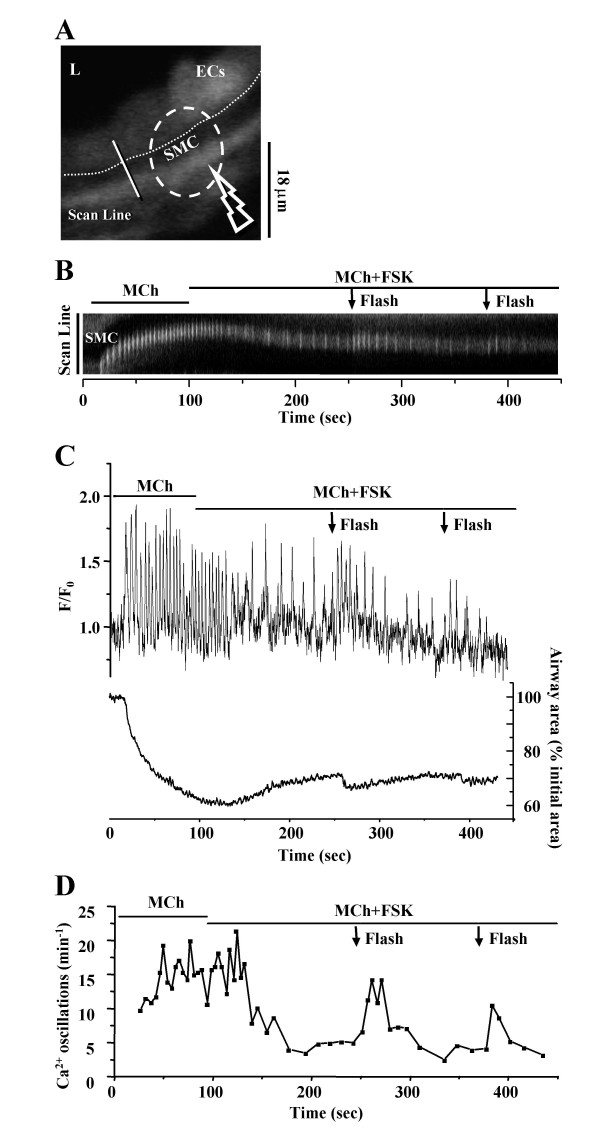
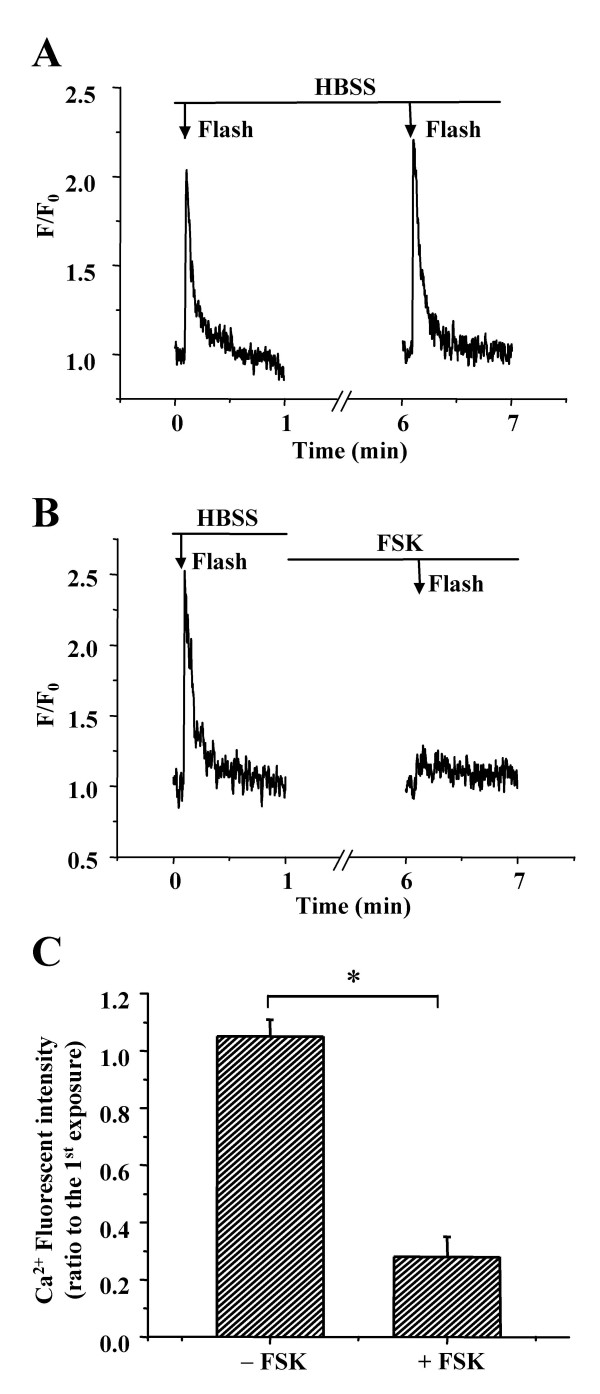
Results: All three cAMP-elevating agents simultaneously induced a reduction in the frequency of Ca2+ oscillations within the SMCs and the relaxation of contracted airways. The decrease in the Ca2+ oscillation frequency correlated with the extent of airway relaxation and was concentration-dependent. The mechanism by which cAMP reduced the frequency of the Ca2+ oscillations was investigated. Elevated cAMP did not affect the re-filling rate of the internal Ca2+ stores after emptying by repetitive exposure to 20 mM caffeine. Neither did elevated cAMP limit the Ca2+ available to stimulate contraction because an elevation of intracellular Ca2+ concentration induced by exposure to a Ca2+ ionophore (ionomycin) or by photolysis of caged-Ca2+ did not reverse the effect of cAMP. Similar results were obtained with iberiotoxin, a blocker of Ca2+-activated K+ channels, which would be expected to increase Ca2+ influx and contraction. By contrast, the photolysis of caged-IP3 in the presence of agonist, to further elevate the intracellular IP3 concentration, reversed the slowing of the frequency of the Ca2+ oscillations and relaxation of the airway induced by FSK. This result implied that the sensitivity of the IP3R to IP3 was reduced by FSK and this was supported by the reduced ability of IP3 to release Ca2+ in SMCs in the presence of FSK.

Conclusion: These results indicate that the relaxant effect of cAMP-elevating agents on airway SMCs is achieved by decreasing the Ca2+ oscillation frequency by reducing internal Ca2+ release through IP3 receptors.


Figures

Figure 1
Figure 1
The contractile response of airways in mouse lung slices to MCh. (A) Low magnification phase-contrast images (scale bar = 50 μm) of the same airway before and 5 minutes after stimulation with 1 μM MCh. L, airway lumen; ECs, epithelial cells; Av, alveolar tissue. (B) The relative change in the area of the airway lumen (% of the initial area) in response to MCh from 1 nM to 1μM. During the interval between each application of MCh (15 min) the airway area was not recorded but the slice was continually washed with sHBSS. (C) The concentration-dependent contractile response of airways to MCh. Each point represents 5 to 7 experiments (mean ± S.E.) in different airways from at least 3 mice. The data were fitted with a logistic function.
Figure 2
Figure 2
Relaxation of contracted airways by ISO. (A) A series of phase-contrast images of the same airway (scale bar = 100 μm) at times indicated by arrows in B (middle trace) showing (1) the initial state, (2) the contracted state induced by MCh (100 nM) and (3) the relaxed state induced by ISO (10 μM). (B) The changes in the area of an airway in response to ISO (10 μM) following contraction with MCh. The airway was contracted with decreasing concentrations of MCh (1μM to 10 nM) for 3 min and exposed to the same concentration of ISO (10 μM) for another 3 min. The slices were washed with sHBSS 15 minutes between each concentration of MCh. (C) Summary of the ISO-induced (10 μM) relaxation of airways contracted with different concentrations of MCh (n = 4 slices from 3 mice). The magnitude of the airway relaxation induced by ISO increased as the concentration of MCh was decreased (*, p < 0.05, comparison between two different MCh concentrations).
Figure 3
Figure 3
The effect of ISO on the Ca2+signaling of airway SMCs. (A) A fluorescence image of part of an airway obtained by two-photon microscopy under resting conditions. L, lumen; ECs, epithelial cells; SMC, smooth muscle cell. Dotted line indicates the interface between ECs and SMCs. Scale bar = 15 μm. The intracellular Ca2+ signaling represented by (B) a line-scan plot, constructed from the white line across the SMC as indicated in A, and the sequence of recorded images and (C) a small ROI in the same airway SMC as shown in B in response to the MCh (200 nM) and ISO (1 μM). (D) The correlation of the Ca2+ oscillation frequency (dotted line) and airway area (solid line) in a representative experiment with contraction induced by MCh (200 nM) and relaxation induced by ISO (10 μM). The Ca2+ oscillation frequency was determined by the time interval between 2 adjacent peaks. The frequency of the Ca2+ oscillations was inversely coupled to the contraction of the airway. (E) The mean concentration-dependent relaxation (solid line, ■) and the change in the frequency of the Ca2+ oscillations (dash line, ▼) induced by ISO in airways contracted with MCh (200 nM). The mean Ca2+ oscillation frequency after ISO exposure was expressed as a ratio to the Ca2+ oscillation frequency during MCh exposure. As the concentration of ISO increased, the Ca2+ oscillation frequency decreased. Each point represents 5 to 8 experiments (mean ± S.E.) in different airways from at least 3 mice for the contraction data and 5 – 6 experiments in different cells from at least 3 mice for the Ca2+ oscillation data. Data were fitted with a logistic function.
Figure 4
Figure 4
The ability of ISO to relax an airway is influenced by repetitive stimulation. (A) Relaxation responses of the same contacted airway (with MCh, 200 nM) in response to the first (black dash line) and subsequent 15 minute-exposures of ISO (1 μM) with the time intervals of 10 minutes (light grey line) and 2 hours (dark grey line). The slices were washed with sHBSS between experiments. (B) The summary of the relative relaxation responses induced by repeated ISO stimulation after different intervals. ISO-induced relaxation declined to about half after 10 minutes but was fully recovered after 18 hours. Relaxation was expressed as a percentage of the initial relaxation response. Data from experiments with 5 different airways from 4 mice (*, p < 0.05 compared to the 1st relaxation).
Figure 5
Figure 5
The effect of FSK and 8-bromo-cAMP on contraction and Ca2+ oscillations of airway SMCs. (A) FSK (10 μM, solid line) and (D) 8-bromo-cAMP (500 μM, solid line) induced an initial quick relaxation followed by slower relaxation. (B) FSK and (E) 8-bromo-cAMP decreased the Ca2+ oscillation frequency initiated by MCh to a slower rate. The changes in the frequency of the Ca2+ oscillations induced by each compound (dotted line in A and D) correspond with opposite changes in airway area (solid line in A and D). (C) With increasing FSK concentration, the relaxation (solid line, ■) increased while the frequency of the Ca2+ oscillations (dotted line, ▼) decreased; each point is the mean ± S.E. from at least 4 different airways from 3 mice. Data points were fitted with a logistic function.
Figure 6
Figure 6
Relationship between the reduction in Ca2+ oscillation frequency in SMCs and airway relaxation. The relaxation state (percentage of the MCh-induced contraction) and corresponding Ca2+ oscillation frequency (ratio to the frequency of MCh-induced Ca2+ oscillations) upon exposure to ISO, FSK and 8-bromo-cAMP (at various concentrations) were plotted and fitted with a logistic function. The data indicates that a greater airway relaxation correlated with a larger reduction in the Ca2+ oscillation frequency.
Figure 7
Figure 7
Effect of FSK on caffeine-induced Ca2+ release. Representative experiments demonstrating (A) contraction and (D) Ca2+ signaling of airway SMCs induced by repetitive exposure to caffeine (20 mM) in the absence of FSK. FSK (10 μM) had no effect on caffeine-induced (B) contraction or (E) Ca2+ signaling. (C) Airway contraction and (F) the peak fluorescence intensity of Ca2+ signaling (ratio of second to first exposure) induced by caffeine (20 mM) in the slices incubated with or without FSK (10 μM). Data represents the mean ± S.E. from 4 different slices from 3 mice.
Figure 8
Figure 8
Effect of flash photolysis of caged-Ca2+ on SMCs treated with MCh and FSK. (A) A fluorescence image of part of an airway obtained by confocal microscopy. L, lumen; ECs, epithelial cells; SMC, smooth muscle cell. The dashed white oval indicates the position and size of the zone of UV illumination (10 s, OD 0.6). Dotted line indicates the interface between ECs and SMCs. Scale bar = 40 μm. The intracellular Ca2+ signaling represented by(B) a line-scan plot, constructed by sequentially aligning the pixels along the length of the SMC (white line indicated in A) and from each recorded fluorescence image and (C) a selected ROI within the SMC and (D) the frequency of Ca2+ oscillations of SMCs in response to flash photolysis of caged-Ca2+ during stimulation with MCh (200 nM) and FSK (10 μM). Flash photolysis induced a temporary rise in [Ca2+]i but did not increase the slow frequency of the Ca2+ oscillations. Representative traces of 6 different slices from 4 mice.
Figure 9
Figure 9
Effect of ionomycin on FSK-induced airway relaxation. (A) Airway contraction in response to MCh (200 nM), FSK (10 μM) and ionomycin (5 μM). Ionomycin initially enhanced the relaxation induced by FSK but subsequently re-contracted the airway. Representative traces from 4 experiments from 3 mice. (B) Changes in intracellular Ca2+ and (C) the frequency of the Ca2+ oscillations induced by MCh (200 nM) and FSK (10 μM) followed by exposure to ionomycin. Ionomycin stopped the Ca2+ oscillation and subsequently elevated the [Ca2+]i. Representative traces of five experiments from 4 mice.
Figure 10
Figure 10
Effect of iberiotoxin on FSK-induced airway relaxation. (A) Airway contraction in response to MCh (200 nM), FSK (10 μM) and IbTX (50 nM). IbTX greatly enhanced the relaxation induced by FSK to fully relax the airway. Representative traces of 6 experiments from 3 mice. (B) Changes in intracellular Ca2+ signaling and (C) the frequency of Ca2+ oscillations induced by MCh (200 nM) and FSK (10 μM) followed by exposure to IbTX (50 nM). The frequency of the Ca2+ oscillations was further slowed by IbTX. Representative traces of 8 experiments from 5 mice.
Figure 11
Figure 11
Effect of flash photolysis of caged-IP3 on SMCs treated with MCh and FSK. (A) A fluorescence image of part of an airway obtained by confocal microscopy. The dashed white oval indicates the position and size of the zone of UV illumination (0.5 s, OD 0.5). L, lumen; ECs, epithelial cells; SMC, smooth muscle cell. Dotted line indicates the interface between ECs and SMCs. Scale bar = 18 μm. Intracellular Ca2+ signaling represented by (B) a line-scan plot, constructed by sequentially aligning the pixels along the line across the SMCs and ECs (white line indicated in A) from each recorded fluorescence image. (C) The simultaneous recording of intracellular Ca2+ signaling of SMC (upper trace, and B), and the changes in airway lumen area (lower trace) and (D) frequency of the Ca2+ oscillations in response to the flash photolysis of caged-IP3 during stimulation with MCh (200 nM) and FSK (10 μM). Repetitive release of IP3 by flash photolysis (0.5 s, OD 0.5, indicated by arrows) increased the frequency of the Ca2+ oscillations induced by MCh and FSK and re-contracted the airway. Representative traces of 6 different slices from 4 mice.
Figure 12
Figure 12
Effect of FSK on the intracellular Ca2+ signaling induced by IP3. The Ca2+ signaling of SMCs induced by repetitive flash-photolysis (0.5 s, OD 1.0, arrows) of caged-IP3 in lung slices incubated (A) without or (B) with FSK for 5 min. Exposure to FSK almost completely abolished the Ca2+ response induced by flash photolysis of IP3. (C) Summary of the changes in Ca2+ signaling (peak fluorescence intensity) induced by IP3 in the slices incubated without or with FSK. The Ca2+ signal after exposure to the sHBSS without or with FSK was expressed as a ratio to the Ca2+ response before exposure. Data represents the mean ± S.E. from at least 5 different slices from 4 mice. *, p < 0.05.
Figure 13
Figure 13
Effect of the ryanodine on contraction and Ca2+ signaling. (A) MCh (200 nM) induced contraction of the same airway in the absence or presence of ryanodine (50 μM, Rya). (B) Changes in fluorescence (upper trace) and frequency of oscillatory Ca2+ signaling (lower trace) of a single airway SMC treated with 200 nM MCh and 50 μM ryanodine. Representative traces of 6 different slices from 4 mice.(C) A fluorescence image of part of the airway obtained by confocal microscopy. The dashed white oval indicates the position and size of the zone of UV illumination (5 s, OD 0.6). L, lumen; ECs, epithelial cells; SMC, smooth muscle cell. Dotted line indicates the interface between ECs and SMCs. Scale bar = 18 μm. Point A was located at the center of the zone of illumination on a single SMC and Point B was located on the same SMC outside the zone of illumination. (D) The local Ca2+ signals at point A and B induced by flash photolysis of caged-Ca2+ in the absence or presence of 50 mM K+ (incubation time of 3 min). Representative traces of 5 different slices from 3 mice.

References

    1. Global Initiative for Asthma. Global Strategy for asthma management and prevention. , National Institute of Health 2002, NIH publication no. 02-3659;
    1. Benovic JL. Novel β2-adrenergic receptor signaling pathways. J Allergy Clin Immunol. 2002;110:S229–35. doi: 10.1067/mai.2002.129370. - DOI - PubMed
    1. McGrogan I, Lu S, Hipworth S, Sormaz L, Eng R, Preocanin D, Daniel EE. Mechanisms of cyclic nucleotide-induced relaxation in canine tracheal smooth muscle. Am J Physiol. 1995;268:L407–13. - PubMed
    1. Hoiting BH, Meurs H, Schuiling M, Kuipers R, Elzinga CR, Zaagsma J. Modulation of agonist-induced phosphoinositide metabolism, Ca2+ signalling and contraction of airway smooth muscle by cyclic AMP-dependent mechanisms. Br J Pharmacol. 1996;117:419–426. - PMC - PubMed
    1. Yang CM, Hsu MC, Tsao HL, Chiu CT, Ong R, Hsieh JT, Fan LW. Effect of cAMP elevating agents on carbachol-induced phosphoinositide hydrolysis and calcium mobilization in cultured canine tracheal smooth muscle cells. Cell Calcium. 1996;19:243–254. doi: 10.1016/S0143-4160(96)90025-1. - DOI - PubMed

Publication types

MeSH terms

LinkOut - more resources