

Distinguishing between linear and exponential cell growth during the division cycle: single-cell studies, cell-culture studies, and the object of cell-cycle research
- PMID: 16504098
- PMCID: PMC1402260
- DOI: 10.1186/1742-4682-3-10
Distinguishing between linear and exponential cell growth during the division cycle: single-cell studies, cell-culture studies, and the object of cell-cycle research
Abstract
Background: Two approaches to understanding growth during the cell cycle are single-cell studies, where growth during the cell cycle of a single cell is measured, and cell-culture studies, where growth during the cell cycle of a large number of cells as an aggregate is analyzed. Mitchison has proposed that single-cell studies, because they show variations in cell growth patterns, are more suitable for understanding cell growth during the cell cycle, and should be preferred over culture studies. Specifically, Mitchison argues that one can glean the cellular growth pattern by microscopically observing single cells during the division cycle. In contrast to Mitchison's viewpoint, it is argued here that the biological laws underlying cell growth are not to be found in single-cell studies. The cellular growth law can and should be understood by studying cells as an aggregate.
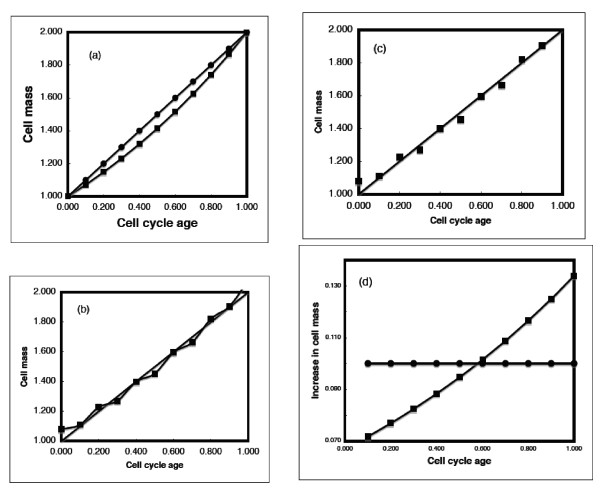
Results: The purpose or objective of cell cycle analysis is presented and discussed. These ideas are applied to the controversy between proponents of linear growth as a possible growth pattern during the cell cycle and the proponents of exponential growth during the cell cycle. Differential (pulse) and integral (single cell) experiments are compared with regard to cell cycle analysis and it is concluded that pulse-labeling approaches are preferred over microscopic examination of cell growth for distinguishing between linear and exponential growth patterns. Even more to the point, aggregate experiments are to be preferred to single-cell studies.
Conclusion: The logical consistency of exponential growth--integrating and accounting for biochemistry, cell biology, and rigorous experimental analysis--leads to the conclusion that proposals of linear growth are the result of experimental perturbations and measurement limitations. It is proposed that the universal pattern of cell growth during the cell cycle is exponential.
Figures

Similar articles
-
Biomass growth rate during the prokaryote cell cycle.Crit Rev Microbiol. 1993;19(1):17-42. doi: 10.3109/10408419309113521. Crit Rev Microbiol. 1993. PMID: 8481211 Review.
-
Distinguishing different modes of growth using single-cell data.Elife. 2021 Dec 2;10:e72565. doi: 10.7554/eLife.72565. Elife. 2021. PMID: 34854811 Free PMC article.
-
Single-cell model of prokaryotic cell cycle.J Theor Biol. 2014 Jan 21;341:78-87. doi: 10.1016/j.jtbi.2013.09.035. Epub 2013 Oct 5. J Theor Biol. 2014. PMID: 24099718
-
Cell cycle dynamics inferred from the static properties of cells in balanced growth.J Gen Microbiol. 1982 Dec;128(12):2877-92. doi: 10.1099/00221287-128-12-2877. J Gen Microbiol. 1982. PMID: 6763937
-
Growth during the cell cycle.Int Rev Cytol. 2003;226:165-258. doi: 10.1016/s0074-7696(03)01004-0. Int Rev Cytol. 2003. PMID: 12921238 Review.
Cited by
-
Mechanical limitation of bacterial motility mediated by growing cell chains.Biophys J. 2022 Jun 21;121(12):2461-2473. doi: 10.1016/j.bpj.2022.05.012. Epub 2022 May 18. Biophys J. 2022. PMID: 35591787 Free PMC article.
-
Optical measurement of cycle-dependent cell growth.Proc Natl Acad Sci U S A. 2011 Aug 9;108(32):13124-9. doi: 10.1073/pnas.1100506108. Epub 2011 Jul 25. Proc Natl Acad Sci U S A. 2011. PMID: 21788503 Free PMC article.
-
Fundamental principles in bacterial physiology-history, recent progress, and the future with focus on cell size control: a review.Rep Prog Phys. 2018 May;81(5):056601. doi: 10.1088/1361-6633/aaa628. Epub 2018 Jan 9. Rep Prog Phys. 2018. PMID: 29313526 Free PMC article. Review.
-
Cell shape dynamics in Escherichia coli.Biophys J. 2008 Jan 1;94(1):251-64. doi: 10.1529/biophysj.107.104398. Epub 2007 Aug 31. Biophys J. 2008. PMID: 17766333 Free PMC article.
-
Cell Size Is Coordinated with Cell Cycle by Regulating Initiator Protein DnaA in E. coli.Biophys J. 2020 Dec 15;119(12):2537-2557. doi: 10.1016/j.bpj.2020.10.034. Epub 2020 Nov 13. Biophys J. 2020. PMID: 33189684 Free PMC article.
References
-
- Helmstetter C. Rate of DNA synthesis during the division cycle of E. coli B/r. J Mol Biol. 1967;24:417–427. doi: 10.1016/0022-2836(67)90228-8. - DOI
Publication types
MeSH terms
Grants and funding
LinkOut - more resources
Full Text Sources
Other Literature Sources
