. 2006 Mar 20;203(3):619-31.
doi: 10.1084/jem.20051474. Epub 2006 Feb 27.

Natural killer cell behavior in lymph nodes revealed by static and real-time imaging

Affiliations

Natural killer cell behavior in lymph nodes revealed by static and real-time imaging

Marc Bajénoff et al. J Exp Med. .

Abstract

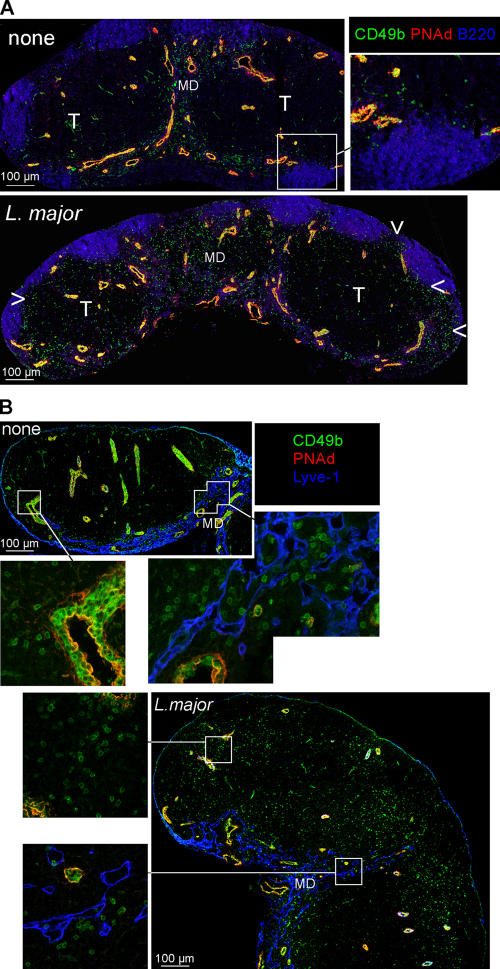
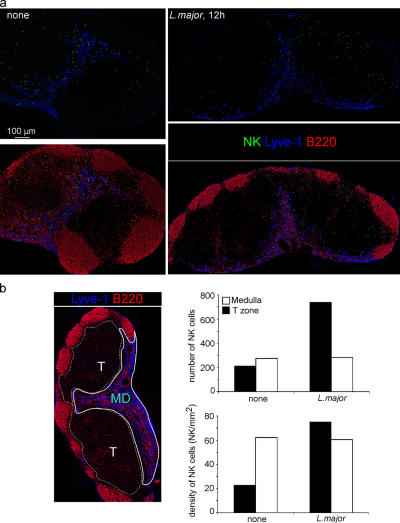
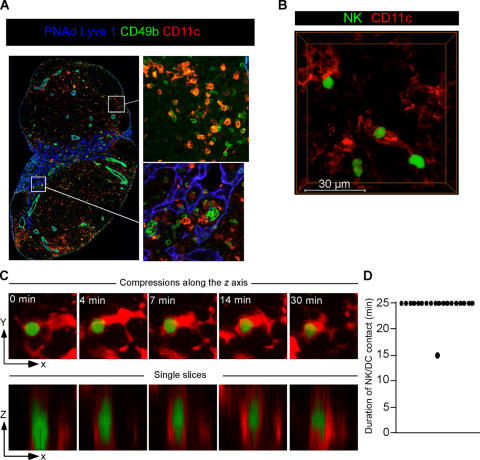
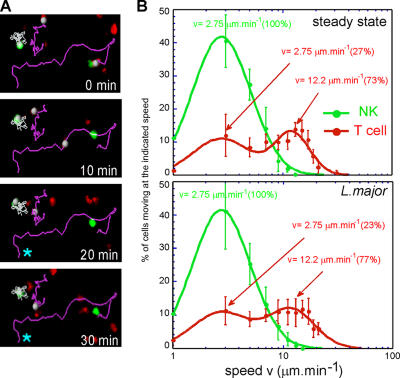
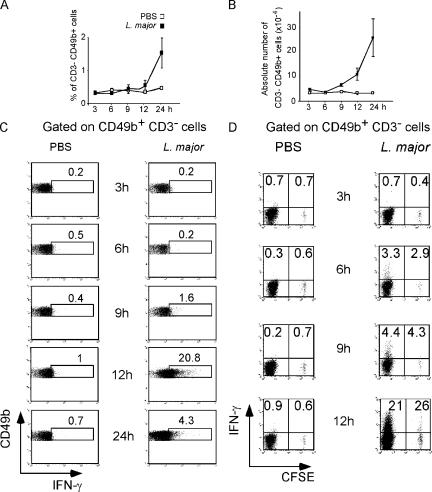
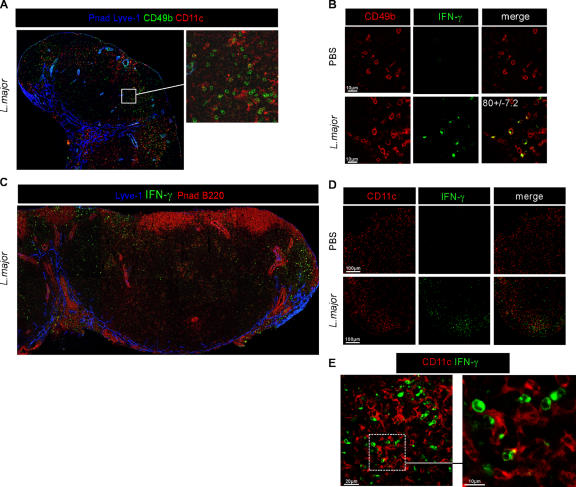
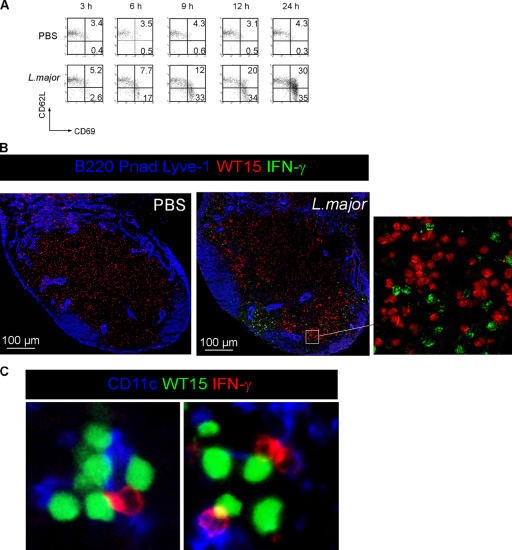
Natural killer (NK) cells promote dendritic cell (DC) maturation and influence T cell differentiation in vitro. To better understand the nature of the putative interactions among these cells in vivo during the early phases of an adaptive immune response, we have used immunohistochemical analysis and dynamic intravital imaging to study NK cell localization and behavior in lymph nodes (LNs) in the steady state and shortly after infection with Leishmania major. In the LNs of naive mice, NK cells reside in the medulla and the paracortex, where they closely associate with DCs. In contrast to T cells, intravital microscopy revealed that NK cells in the superficial regions of LNs were slowly motile and maintained their interactions with DCs over extended times in the presence or absence of immune-activating signals. L. major induced NK cells to secrete interferon-gamma and to be recruited to the paracortex, where concomitant CD4 T cell activation occurred. Therefore, NK cells form a reactive but low mobile network in a strategic area of the LN where they can receive inflammatory signals, interact with DCs, and regulate colocalized T cell responses.


Figures

Figure 1.
Figure 1.
Distribution of NK cells in mice LNs. Mice were injected with L. major into the left ear and with PBS into the right ear. Left and right ear-draining LNs were collected 12 h after infection. Tissue sections from 10 individual LNs were analyzed for each condition by confocal microscopy. LN sections were stained for CD49b (green), PNAd (red), and either B220 (blue, A) or Lyve-1 (blue, B) to reveal the location of NK cells in relationship to the B cell follicles, HEVs, and the medulla (MD). Representative LN sections show the localization of NK cells in the paracortex and medulla of LNs draining either the infected (bottom) or contralateral ear (top). A representative picture for each group is shown. T, T cell zone. Arrows indicate regions of the LN where NK cells accumulate.
Figure 2.
Figure 2.
Quantification of NK cell distribution in LNs. BALB/c mice were injected with 107 CFSE-labeled NK cells. Recipient mice were injected or not injected with L. major in the ears. Ear-draining LNs were collected 12 h after infection. Tissue sections from eight individual LNs were analyzed for each condition by confocal microscopy. (a) LN sections were stained for B220 (red) and Lyve-1 (blue) to reveal the location of NK cells (green) in relationship to the B cell follicles and medulla. Representative LN sections show the localization of NK cells in the paracortex and the medulla of LNs draining either a control (left) or infected (right) site. (b) The total number (top graph) and density (bottom graph) of dye-labeled NK cells in the T cell zone (dashed line) and the medulla (MD; white line) were determined. T, T cell zone.
Figure 3.
Figure 3.
Colocalization and physical interaction of NK cells and DCs in LNs. (A and B) To reveal potential NK–DC interactions, LNs were collected from BALB/c mice that were either left untreated or transferred with CFSE-labeled exogenous NK cells 24 h before LN harvest. Resident DCs were visualized with CD11c staining, whereas B220 staining of B cell follicles, PNAd staining of HEVs, and Lyve-1 staining of lymphatic vessels were used to provide anatomical landmarks as in Fig. 1. Endogenous NK cells were revealed with CD49b staining (A), whereas transferred NK cells were identified by CFSE (B). (A) A section representative of 10 analyzed LNs shows colocalization of DCs and NK cells in paracortical regions below B cell follicles and in the medulla at a low magnification. The insets show enlarged images of paracortical and medullary areas where physical contacts between NK cells and DCs can be seen. (B) A three-dimensional volume representative of six examined LNs shows physical interactions between exogenously transferred NK cells and resident DCs. (C) Splenic DCs were enriched from BALB/c mice, labeled with CellTracker blue (red), and injected s.c. into recipient footpads. CFSE-labeled purified NK cells (green) were transferred i.v. into the recipients 24 h later. Mice were anesthetized 12 h later, and the popliteal LN was exposed surgically. Images were collected for 25 min in a DC-enriched area (red) where NK–DC clusters could be observed at the beginning of the imaging sessions. The rows show compression along the z axis (top) or individual slices where NK–DC contacts are unambiguous (bottom) at the indicated times within a continuous time-lapse sequence. (D) Duration of all NK–DC interactions (dots) observed.
Figure 4.
Figure 4.
Intravital analysis of NK cells in LNs by 2-P microscopy. BALB/c mice were injected with CFSE-labeled NK cells (green) and CMTPX-labeled T cells (red). They were either left untreated or were infected 24 h later with L. major in the footpad. Animals were anesthetized 12 h later, and popliteal LNs were imaged. (A) Tracks of two T cells (purple) and one NK cell (white) during a 30-min period. These tracks are representative of each cell type. Blue stars indicate the last recorded position of the fastest T cell. (B) Velocity distribution of T cells (red line) and NK cells (green line) migrating in control LNs or LNs draining the site of L. major infection. Velocities were measured in three-dimensional space from point-to-point tracks at 20–30 s intervals. Four mice each were analyzed in the steady state and after infection. Error bars represent SD.
Figure 5.
Figure 5.
Rapid IFN-γ secretion by NK cells recruited from blood upon L. major infection. (A–C) Mice were injected with L. major in the left ear and PBS in the right ear, and ear-draining LNs were collected at the indicated times after infection. The frequency (A) and total number (B) of CD3 CD49b+ NK cells were measured (mean ± SD [error bars]; n = 4). (C) The frequencies of IFN-γ producers among CD3 CD49b+ NK cells were determined and are indicated in boxes for each panel. Data represent four experiments with similar results. (D) BALB/c mice were injected i.v. with CFSE-labeled NK cells followed 24 h later with L. major infection in the left and PBS injection in the right ear. Mice were killed at the indicated times, and LN CD3 CD49b+ NK cells were analyzed by flow cytometry. Numbers in the top quadrants indicate the frequency of IFN-γ producers among endogenous CFSE and transferred CFSE+ NK cells. One of three experiments with similar results is shown.
Figure 6.
Figure 6.
Specific recruitment of NK cells in the T cell zone and their associations with DCs upon L. major infection. BALB/c mice were injected with L. major in the left ear and PBS in the right ear, and tissue sections were prepared from ear-draining LNs 12 h later. (A) A representative section stained for B220, CD49b, CD11c, Lyve-1, and PNAd reveals the association of NK cells with DCs in outer paracortical areas below B cell follicles. A region where numerous NK cells and DCs were in physical contact is shown in the enlarged inset. (B) Staining for CD49b and IFN-γ demonstrates the specific induction of IFN-γ production in NK cells upon L. major infection. The number is the percentage of CD49b+ cells among all IFN-γ producers (mean ± SD). A total of 10 LN fields were scored. (C) A representative section costained for IFN-γ, PNAd, B220, and Lyve-1 shows that IFN-γ production occurs preferentially between and under B cell follicles. (D and E) Representative sections costained for CD11c and IFN-γ show that IFN-γ producers were in close contact with DCs.
Figure 7.
Figure 7.
Distribution of NK cells, IFN-γ–secreting cells, and parasite-specific CD4+ T cells in LNs. CD90.1+ CD4+ cells from WT15 TCR transgenic mice were labeled with CFSE and injected into CD90.1 BALB/c mice. Recipient mice were injected 24 h later with L. major in the right ear and PBS in the left ear. (A) The activation status of WT15 cells was examined by flow cytometry at the indicated times upon staining with anti-CD62L and anti-CD69 mAb. Data show dot plots after gating on CD90.1+ cells and are representative of three experiments. Numbers indicate the percentage of cells in each quadrant. (B and C) Mice were killed 12 h after injection, and the distribution of WT15 cells and IFN-γ–secreting NK cells was analyzed on LN sections after staining for B220, PNAd, Lyve-1, and IFN-γ. (B) Representative sections are shown, and the inset shows the colocalization of CD4 T cells undergoing activation and IFN-γ–secreting cells. (C) Pictures show clusters of CD11c+ DCs, WT15 cells, and IFN-γ–secreting cells. (A–C) A total of 10 LNs were examined for each infection and control condition.

References

    1. French, A.R., and W.M. Yokoyama. 2003. Natural killer cells and viral infections. Curr. Opin. Immunol. 15:45–51. - PubMed
    1. Yokoyama, W.M., S. Kim, and A.R. French. 2004. The dynamic life of natural killer cells. Annu. Rev. Immunol. 22:405–429. - PubMed
    1. Fernandez, N.C., A. Lozier, C. Flament, P. Ricciardi-Castagnoli, D. Bellet, M. Suter, M. Perricaudet, T. Tursz, E. Maraskovsky, and L. Zitvogel. 1999. Dendritic cells directly trigger NK cell functions: cross-talk relevant in innate anti-tumor immune responses in vivo. Nat. Med. 5:405–411. - PubMed
    1. Piccioli, D., S. Sbrana, E. Melandri, and N.M. Valiante. 2002. Contact-dependent stimulation and inhibition of dendritic cells by natural killer cells. J. Exp. Med. 195:335–341. - PMC - PubMed
    1. Gerosa, F., B. Baldani-Guerra, C. Nisii, V. Marchesini, G. Carra, and G. Trinchieri. 2002. Reciprocal activating interaction between natural killer cells and dendritic cells. J. Exp. Med. 195:327–333. - PMC - PubMed

Publication types

MeSH terms

Substances