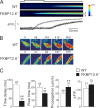
Ca2+ -induced Ca2+ release through localized Ca2+ uncaging in smooth muscle
- PMID: 16505145
- PMCID: PMC2151500
- DOI: 10.1085/jgp.200509422
Ca2+ -induced Ca2+ release through localized Ca2+ uncaging in smooth muscle
Abstract
Ca(2+)-induced Ca(2+) release (CICR) from the sarcoplasmic reticulum (SR) occurs in smooth muscle as spontaneous SR Ca(2+) release or Ca(2+) sparks and, in some spiking tissues, as Ca(2+) release that is triggered by the activation of sarcolemmal Ca(2+) channels. Both processes display spatial localization in that release occurs at a higher frequency at specific subcellular regions. We have used two-photon flash photolysis (TPFP) of caged Ca(2+) (DMNP-EDTA) in Fluo-4-loaded urinary bladder smooth muscle cells to determine the extent to which spatially localized increases in Ca(2+) activate SR release and to further understand the molecular and biophysical processes underlying CICR. TPFP resulted in localized Ca(2+) release in the form of Ca(2+) sparks and Ca(2+) waves that were distinguishable from increases in Ca(2+) associated with Ca(2+) uncaging, unequivocally demonstrating that Ca(2+) release occurs subsequent to a localized rise in [Ca(2+)](i). TPFP-triggered Ca(2+) release was not constrained to a few discharge regions but could be activated at all areas of the cell, with release usually occurring at or within several microns of the site of photolysis. As expected, the process of CICR was dominated by ryanodine receptor (RYR) activity, as ryanodine abolished individual Ca(2+) sparks and evoked release with different threshold and kinetics in FKBP12.6-null cells. However, TPFP CICR was not completely inhibited by ryanodine; Ca(2+) release with distinct kinetic features occurred with a higher TPFP threshold in the presence of ryanodine. This high threshold release was blocked by xestospongin C, and the pharmacological sensitivity and kinetics were consistent with CICR release at high local [Ca(2+)](i) through inositol trisphosphate (InsP(3)) receptors (InsP(3)Rs). We conclude that CICR activated by localized Ca(2+) release bears essential similarities to those observed by the activation of I(Ca) (i.e., major dependence on the type 2 RYR), that the release is not spatially constrained to a few specific subcellular regions, and that Ca(2+) release through InsP(3)R can occur at high local [Ca(2+)](i).
Figures


Comment in
-
On the loose: uncaging Ca2+ -induced Ca2+ release in smooth muscle.J Gen Physiol. 2006 Mar;127(3):221-3. doi: 10.1085/jgp.200609510. J Gen Physiol. 2006. PMID: 16505144 Free PMC article. No abstract available.
Similar articles
-
Localized Ca2+ uncaging induces Ca2+ release through IP3R in smooth muscle.Acta Pharmacol Sin. 2006 Jul;27(7):939-44. doi: 10.1111/j.1745-7254.2006.00389.x. Acta Pharmacol Sin. 2006. PMID: 16787580
-
On the loose: uncaging Ca2+ -induced Ca2+ release in smooth muscle.J Gen Physiol. 2006 Mar;127(3):221-3. doi: 10.1085/jgp.200609510. J Gen Physiol. 2006. PMID: 16505144 Free PMC article. No abstract available.
-
RYR2 proteins contribute to the formation of Ca(2+) sparks in smooth muscle.J Gen Physiol. 2004 Apr;123(4):377-86. doi: 10.1085/jgp.200308999. Epub 2004 Mar 15. J Gen Physiol. 2004. PMID: 15024040 Free PMC article.
-
Pernicious attrition and inter-RyR2 CICR current control in cardiac muscle.J Mol Cell Cardiol. 2013 May;58:53-8. doi: 10.1016/j.yjmcc.2013.01.011. Epub 2013 Jan 28. J Mol Cell Cardiol. 2013. PMID: 23369697 Free PMC article. Review.
-
Sarcolemma agonist-induced interactions between InsP3 and ryanodine receptors in Ca2+ oscillations and waves in smooth muscle.Biochem Soc Trans. 2003 Oct;31(Pt 5):920-4. doi: 10.1042/bst0310920. Biochem Soc Trans. 2003. PMID: 14505449 Review.
Cited by
-
Pan-junctional sarcoplasmic reticulum in vascular smooth muscle: nanospace Ca2+ transport for site- and function-specific Ca2+ signalling.J Physiol. 2013 Apr 15;591(8):2043-54. doi: 10.1113/jphysiol.2012.246348. Epub 2013 Jan 21. J Physiol. 2013. PMID: 23339179 Free PMC article. Review.
-
Cardiovascular imaging using two-photon microscopy.Microsc Microanal. 2008 Dec;14(6):492-506. doi: 10.1017/S1431927608080835. Microsc Microanal. 2008. PMID: 18986603 Free PMC article. Review.
-
Photon-directed multiplexed enzymatic DNA synthesis for molecular digital data storage.Nat Commun. 2020 Oct 16;11(1):5246. doi: 10.1038/s41467-020-18681-5. Nat Commun. 2020. PMID: 33067441 Free PMC article.
-
Functional cardiac imaging by random access microscopy.Front Physiol. 2014 Oct 20;5:403. doi: 10.3389/fphys.2014.00403. eCollection 2014. Front Physiol. 2014. PMID: 25368580 Free PMC article.
-
Origin of spontaneous activity in neonatal and adult rat bladders and its enhancement by stretch and muscarinic agonists.Am J Physiol Renal Physiol. 2007 Mar;292(3):F1065-72. doi: 10.1152/ajprenal.00229.2006. Epub 2006 Nov 14. Am J Physiol Renal Physiol. 2007. PMID: 17107944 Free PMC article.
References
-
- Bezprozvanny, I., J. Watras, and B.E. Ehrlich. 1991. Bell-shaped calcium-response curves of Ins(1,4,5)P3 and calcium-gated channels from endoplasmic reticulum of cerebellum. Nature. 351:751–754. - PubMed
-
- Cannell, M.B., H. Cheng, and W.J. Lederer. 1995. The control of calcium release in heart muscle. Science. 268:1045–1049. - PubMed
-
- DelPrincipe, F., M. Egger, G.C. Ellis-Davies, and E. Niggli. 1999. Two-photon and UV-laser flash photolysis of the Ca2+ cage, dimethoxynitrophenyl-EGTA-4. Cell Calcium. 25:85–91. - PubMed
Publication types
MeSH terms
Substances
Grants and funding
LinkOut - more resources
Full Text Sources
Research Materials
Miscellaneous

