. 2006 Mar;127(3):267-76.
doi: 10.1085/jgp.200509409. Epub 2006 Feb 14.

Interaction of acid-sensing ion channel (ASIC) 1 with the tarantula toxin psalmotoxin 1 is state dependent

Affiliations

Interaction of acid-sensing ion channel (ASIC) 1 with the tarantula toxin psalmotoxin 1 is state dependent

Xuanmao Chen et al. J Gen Physiol. 2006 Mar.

Abstract

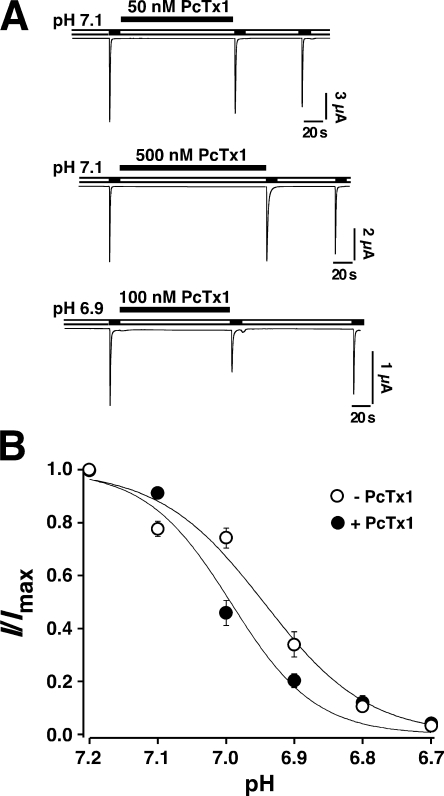
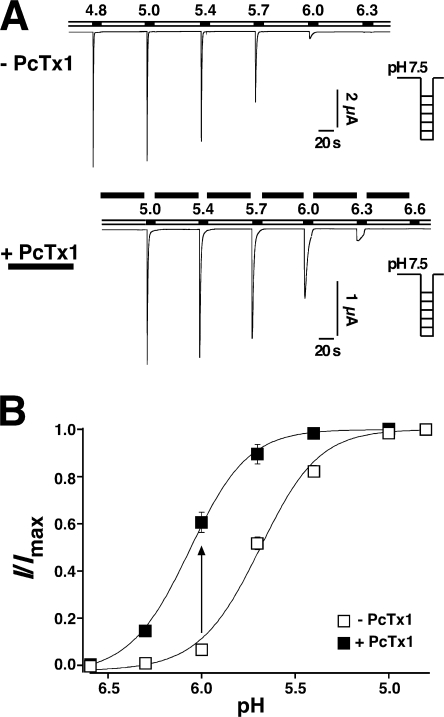
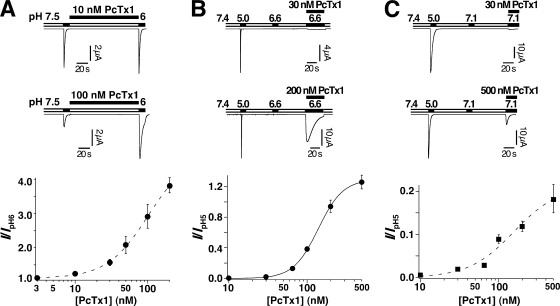
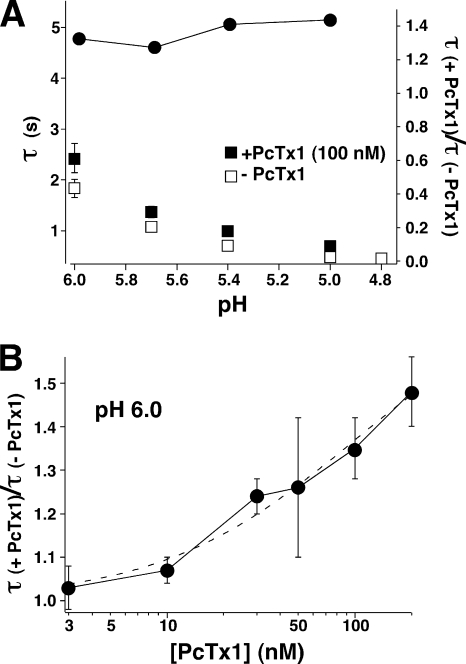
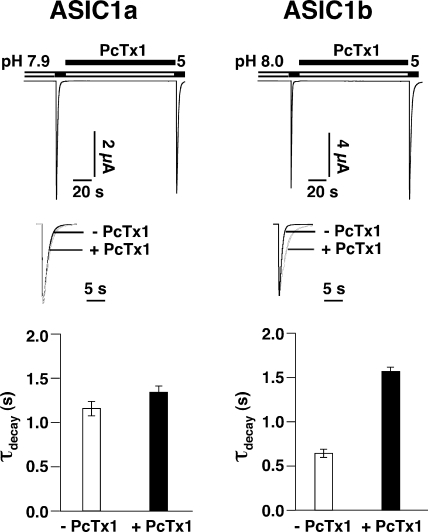
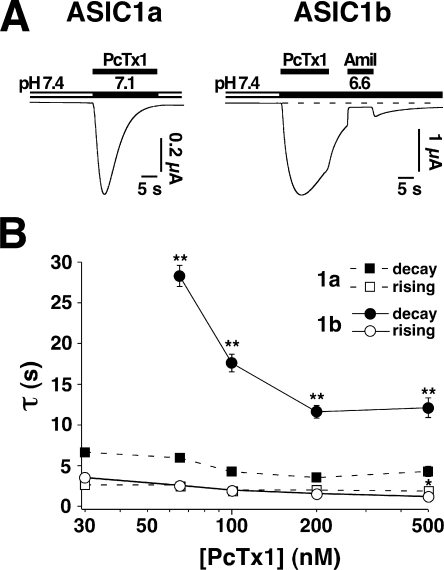
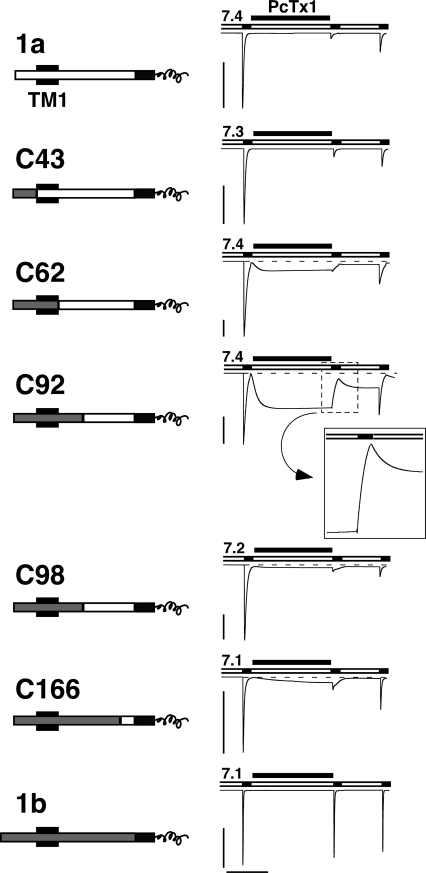
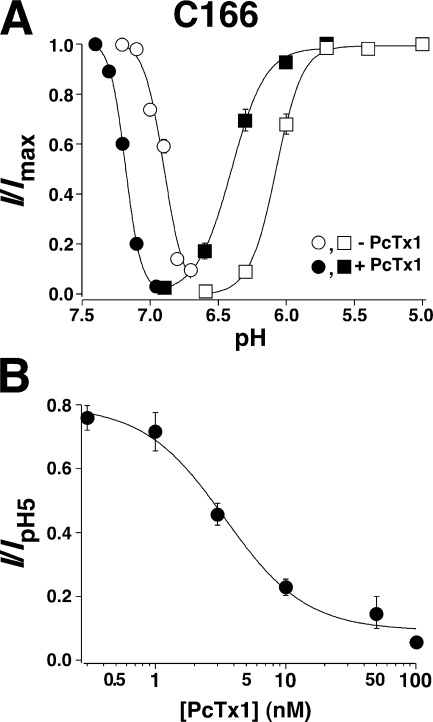
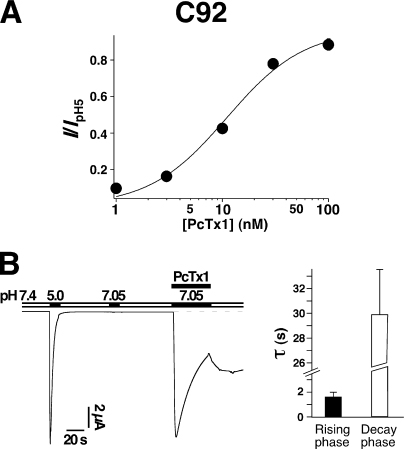
Acid-sensing ion channels (ASICs) are Na(+) channels gated by extracellular H(+). Six ASIC subunits that are expressed in neurons have been characterized. The tarantula toxin psalmotoxin 1 has been reported to potently and specifically inhibit homomeric ASIC1a and has been useful to characterize ASICs in neurons. Recently we have shown that psalmotoxin 1 inhibits ASIC1a by increasing its apparent affinity for H(+). However, the mechanism by which PcTx1 increases the apparent H(+) affinity remained unclear. Here we show that PcTx1 also interacts with ASIC1b, a splice variant of ASIC1a. However, PcTx1 does not inhibit ASIC1b but promotes its opening; under slightly acidic conditions, PcTx1 behaves like an agonist for ASIC1b. Our results are most easily explained by binding of PcTx1 with different affinities to different states (closed, open, and desensitized) of the channel. For ASIC1b, PcTx1 binds most tightly to the open state, promoting opening, whereas for ASIC1a, it binds most tightly to the open and the desensitized state, promoting desensitization.


Figures

(SCHEME 1)
(SCHEME 1)
Figure 1.
Figure 1.
PcTx1 did not strongly inhibit ASIC1b. (A) ASIC1b currents were repeatedly activated by pH 5.0 for 10 s. Even 500 nM PcTx1 did not inhibit the current, when it was applied at pH 7.1 (n = 5). When applied at pH 6.9, 100 nM PcTx1 slightly inhibited the current (n = 6). (B) H+ dependence of steady-state desensitization of ASIC1b currents in the absence (n = 6, open circles) or presence (n = 6, filled circles) of 100 nM PcTx1. PcTx1 was applied for 120 s in the conditioning period; available channels were assessed with pH 5.0. Solid lines are fits of the mean values of each data point to a Hill function (Eq. 1). PcTx1 slightly but significantly (P = 0.04) shifted the steady-state desensitization curve of ASIC1b leftwards.
Figure 2.
Figure 2.
PcTx1 facilitated opening of ASIC1b. (A) Representative current traces elicited by pH ranging from 4.8 to 6.6 with conditioning pH 7.5 (applied for 60 s). Top, without PcTx1; bottom, with 100 nM PcTx1. (B) H+ dependence of ASIC1b activation in the absence (n = 7, open squares) or in the presence (n = 6, filled squares) of 100 nM PcTx1. Solid lines are fits of the mean values of each data point to a Hill function (Eq. 1). PcTx1 significantly (P < 0.01) shifted the pH activation curve to lower H+ concentrations. The arrow illustrates how PcTx1 potentiates currents at pH 6.0, as shown in Fig. 3 A.
Figure 3.
Figure 3.
(A) PcTx1 potentiated ASIC1b currents elicited by pH 6.0. Top, representative current traces. Conditioning pH was 7.5. PcTx1 was applied in the conditioning period for 120 s. Bottom, concentration–response relationship (n = 5–9). Fit to the Hill equation revealed half-maximal potentiation at 101 nM (dashed line). Since a maximal response was not reached, this EC50 value provides a lower limit for the apparent affinity. (B) PcTx1 directly and robustly opened ASIC1b. Top, different concentrations of PcTx1 were coapplied with pH 6.6. pH 6.6 alone did not open ASIC1b. Bottom, concentration–response relationship. Solid line represents a fit to the Hill equation and revealed half-maximal potentiation at 139 nM (n = 4–8). (C) PcTx1 directly opened ASIC1a. Top, different concentrations of PcTx1 were coapplied with pH 7.1 (n = 4–10). pH 7.1 alone did not open ASIC1a. Bottom, concentration–response relationship. Fit to the Hill equation revealed half-maximal potentiation at 156 nM (dashed line), providing a lower limit for the apparent affinity.
Figure 4.
Figure 4.
PcTx1 slowed down desensitization of ASIC1b. (A) Diagram showing the time constant of desensitization with and without 100 nM PcTx1 at different pH values (squares). Data are from measurements like the one shown in Fig. 2 A. The ratio of both time constants is shown in the same diagram (filled circles). It was not pH dependent. (B) Diagram showing the dependence of the ratio of the time constant of desensitization with and without PcTx1 at different concentrations of PcTx1. pH used to activate ASIC1b channels was always pH 6.0. Data are from measurements like the one shown in Fig. 3 A. The dashed line represents a fit to the Hill equation assuming an EC50 of 100 nM, as determined in Fig. 3, A and B.
Figure 5.
Figure 5.
PcTx1 significantly prolonged the desensitization of ASIC1 currents. 500 nM PcTx1 slightly but significantly (P < 0.01, n = 5) slowed down desensitization of ASIC1a currents. Desensitization of ASIC1b currents was more strongly slowed down (P ≪ 0.01, n = 6). Conditioning pH was pH 7.9 for ASIC1a and pH 8.0 for ASIC1b, respectively. Acidic test pH was always pH 5.0. Top, examples of current traces. Scaled overlaid traces before and after PcTx1 application are shown for better comparison. Bottom, bars representing desensitization time constants of ASIC1 currents before and after PcTx1 application.
Figure 6.
Figure 6.
PcTx1 opens ASIC1b more persistently than ASIC1a. (A) When coapplied with pH 7.1, 100 nM PcTx1 induced relatively transient ASIC1a currents (left, n = 7). ASIC1b currents that were induced under comparable conditions were of greater relative amplitude and decayed more slowly. They could be blocked by 100 μM amiloride (right, n = 6). (B) Diagram showing the dependence on the PcTx1 concentration of the time constant describing the rising and the decay phase of the PcTx1-elicited currents, determined in the continuous presence of PcTx1 (n = 4–11 for ASIC1a; n = 4–12 for ASIC1b). The time constants of the rising phase were similar for ASIC1a and ASIC1b currents, while for the decay phase, they were significantly different. For ASIC1b, the decay time constant initially decreased with increasing concentrations of PcTx1 but remained constant around 12 s for high concentrations of PcTx1. Part of the data for ASIC1a have already been published (Chen et al., 2005). **, P < 0.01.
Figure 7.
Figure 7.
PcTx1 inhibits chimeras between ASIC1a and 1b. Left, chimeras are schematically drawn. NH2-terminal sequences from ASIC1a are shown as open bars, those from ASIC1b as gray bars. The first transmembrane domain TM1 is indicated as a black box and the common COOH terminus is shown as a black bar; only its first part is shown. The chimeras did have a shorter NH2 terminus than ASIC1b; this shorter NH2 terminus corresponds to M3 in Bässler et al. (2001). However, since the missing part of the NH2 terminus of ASIC1b is supposed to be located in the cytoplasm and since chimera C43 interacted with PcTx1 like ASIC1a, this NH2-terminal part does not seem to have any strong influence on the interaction with PcTx1. Right, PcTx1 strongly inhibited the currents of ASIC1a and all chimeras, but not of ASIC1b. Conditioning pH was chosen according to the pH50 of steady-state desensitization of each channel. Acidic test pH was always pH 5.0. PcTx1 (50 nM) was applied in the conditioning period for 120 s. Note the opening of chimeras C61, C92, C98, and C166 by application of PcTx1. The transient decrease in current amplitude with C92, after washout of PcTx1 and application of pH 5.0, is enlarged. Scale bars correspond to 5 μA and 60 s, respectively. Peak current amplitudes (mean ± SD) were −11.6 ± 6.1 μA for ASIC1a (n = 7), −35.9 ± 18.2 μA for C43 (n = 6), −8.4 ± 9.9 μA for C61 (n = 6), −12.3 ± 4.5 μA for C91 (n = 5), −12.0 ± 4.0 μA for C98 (n = 3), −11.4 ± 3.1 μA for C166 (n = 5), and −11.1 ± 6.0 μA for ASIC1b (n = 9).
Figure 8.
Figure 8.
(A) PcTx1 robustly shifted the steady-state desensitization and activation curves of C166. pH50 of activation was pH 6.07 ± 0.05 (n = 7) in the absence of PcTx1 (open squares) and pH 6.40 ± 0.06 n = 5, in the presence of 100 nM PcTx1 (closed squares). pH50 of steady-state desensitization was pH 6.90 ± 0.01 (n = 5) in the absence of PcTx1 (open circles) and pH 7.17 ± 0.01 (n = 5) in the presence of 100 nM PcTx1 (closed circles). Solid lines are fits of the mean values of each data point to the Hill function (Eq. 1).(B) Concentration–response relationship for inhibition of C166 currents by PcTx1. Different concentrations of the toxin were applied for 120 s during the conditioning period with pH 7.1. The line represents a fit to the Hill equation (IC50 = 3.4 nM; n = 8–10).
Figure 9.
Figure 9.
(A) Concentration–response relationship for activation of chimera C92 by PcTx1. Different concentrations of the toxin were coapplied with pH 7.05 for 40 s (n = 5–6). The line represents a fit to the Hill equation (EC50 = 11 nM). (B) PcTx1 robustly opened chimera C92. Left, 100 nM PcTx1 was coapplied with pH 7.05 (n = 6). pH 7.05 alone did not open C92. Note the rebound of the current amplitude after returning to pH 7.4. Right, bars representing time constants of the rising and of the decay phase of the current.
(SCHEME 2)
(SCHEME 2)

References

    1. Babini, E., M. Paukert, H.S. Geisler, and S. Gründer. 2002. Alternative splicing and interaction with di- and polyvalent cations control the dynamic range of acid-sensing ion channel 1 (ASIC1). J. Biol. Chem. 277:41597–41603. - PubMed
    1. Balser, J.R., H.B. Nuss, D.W. Orias, D.C. Johns, E. Marban, G.F. Tomaselli, and J.H. Lawrence. 1996. Local anesthetics as effectors of allosteric gating. Lidocaine effects on inactivation- deficient rat skeletal muscle Na channels. J. Clin. Invest. 98:2874–2886. - PMC - PubMed
    1. Baron, A., R. Waldmann, and M. Lazdunski. 2002. ASIC-like, proton- activated currents in rat hippocampal neurons. J. Physiol. 539:485–494. - PMC - PubMed
    1. Bean, B.P. 1984. Nitrendipine block of cardiac calcium channels: high-affinity binding to the inactivated state. Proc. Natl. Acad. Sci. USA. 81:6388–6392. - PMC - PubMed
    1. Benson, C.J., J. Xie, J.A. Wemmie, M.P. Price, J.M. Henss, M.J. Welsh, and P.M. Snyder. 2002. Heteromultimers of DEG/ENaC subunits form H+-gated channels in mouse sensory neurons. Proc. Natl. Acad. Sci. USA. 99:2338–2343. - PMC - PubMed

Publication types

MeSH terms