. 2006 Mar;127(3):341-52.
doi: 10.1085/jgp.200509418.

Access of extracellular cations to their binding sites in Na,K-ATPase: role of the second extracellular loop of the alpha subunit

Affiliations

Access of extracellular cations to their binding sites in Na,K-ATPase: role of the second extracellular loop of the alpha subunit

Oihana Capendeguy et al. J Gen Physiol. 2006 Mar.

Abstract

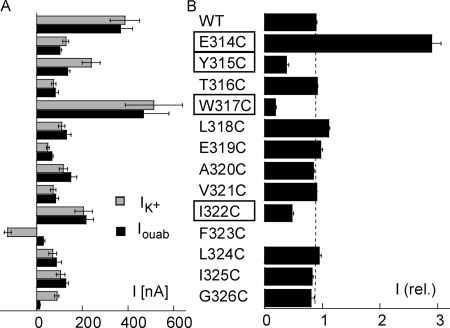
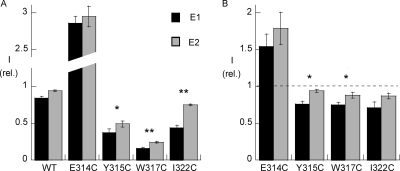
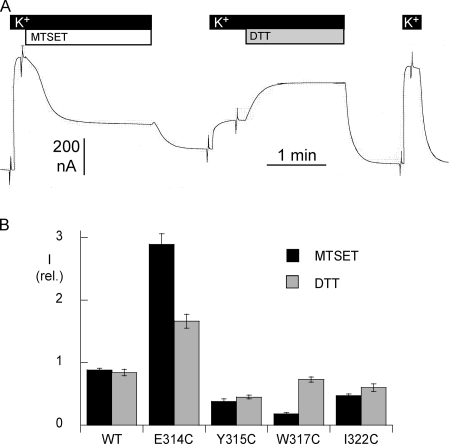
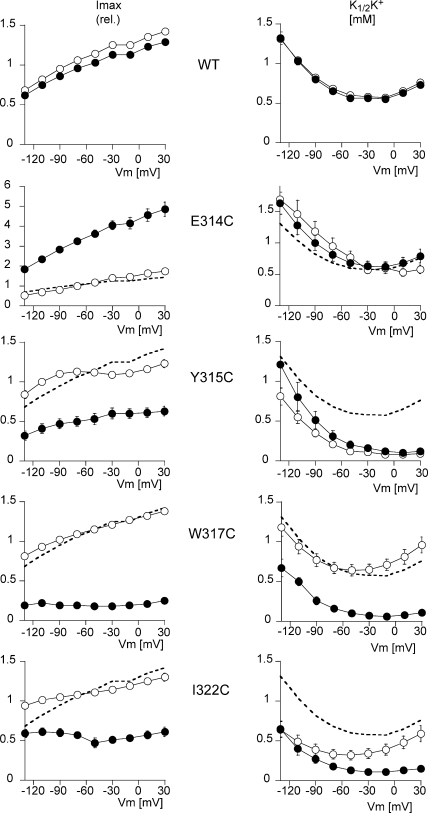
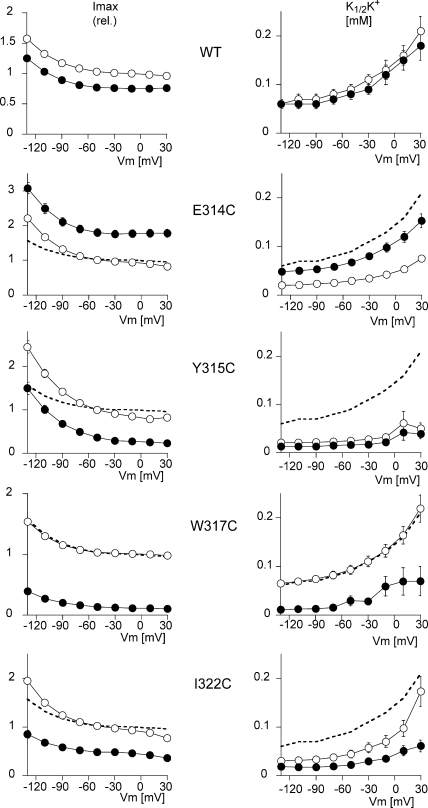
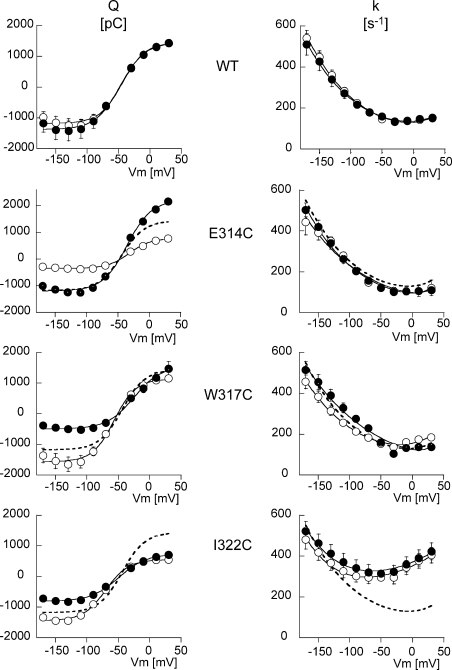
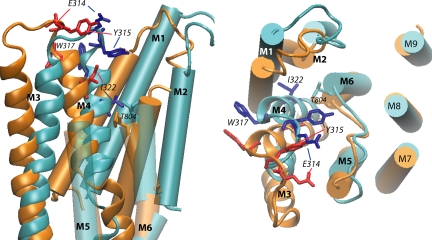
Na,K-ATPase, the main active transport system for monovalent cations in animal cells, is responsible for maintaining Na(+) and K(+) gradients across the plasma membrane. During its transport cycle it binds three cytoplasmic Na(+) ions and releases them on the extracellular side of the membrane, and then binds two extracellular K(+) ions and releases them into the cytoplasm. The fourth, fifth, and sixth transmembrane helices of the alpha subunit of Na,K-ATPase are known to be involved in Na(+) and K(+) binding sites, but the gating mechanisms that control the access of these ions to their binding sites are not yet fully understood. We have focused on the second extracellular loop linking transmembrane segments 3 and 4 and attempted to determine its role in gating. We replaced 13 residues of this loop in the rat alpha1 subunit, from E314 to G326, by cysteine, and then studied the function of these mutants using electrophysiological techniques. We analyzed the results using a structural model obtained by homology with SERCA, and ab initio calculations for the second extracellular loop. Four mutants were markedly modified by the sulfhydryl reagent MTSET, and we investigated them in detail. The substituted cysteines were more readily accessible to MTSET in the E1 conformation for the Y315C, W317C, and I322C mutants. Mutations or derivatization of the substituted cysteines in the second extracellular loop resulted in major increases in the apparent affinity for extracellular K(+), and this was associated with a reduction in the maximum activity. The changes produced by the E314C mutation were reversed by MTSET treatment. In the W317C and I322C mutants, MTSET also induced a moderate shift of the E1/E2 equilibrium towards the E1(Na) conformation under Na/Na exchange conditions. These findings indicate that the second extracellular loop must be functionally linked to the gating mechanism that controls the access of K(+) to its binding site.


Figures

Figure 1.
Figure 1.
(A) Functional expression of Na,K-ATPase cysteine mutants. The K+-induced current (IK+, gray bars) and ouabain-sensitive current (Iouab, black bars) are shown for oocytes injected with the cRNA of the β1 and α1 subunits of the WT and cysteine mutants of residue positions 314–326 of the α1 subunit. Currents were recorded at −50 mV. Positive current values indicate an outward current. There were between 4 and 15 measurements in each group. (B) Effect of MTSET. The current measured after exposure to 250 μM MTSET for 2 min is reported after normalizing for the current measured before exposure to MTSET. There were between five and eight measurements in each case. The four mutants showing major modifications after MTSET treatment, and which were studied in greater detail, are highlighted.
Figure 2.
Figure 2.
(A) Effects of MTSET on four Na,K-ATPase cysteine mutants: conformation-dependent effects. Means ± SEM of K+-induced currents at −50 mV in oocytes expressing the cysteine mutants or WT α subunit. The currents, induced by adding 10 mM external K+ to a 100 mM external Na+ solution, measured after MTSET exposure are expressed after normalizing for the current measured before exposure to MTSET. MTSET was perfused for 2 min at a concentration of 250 μM, either with 10 mM external K+, to shift the equilibrium toward the E1 conformation (black bars), or in a Na+-free and K+-free solution (gray bars), to promote the E2P conformation of the Na,K-ATPase. Between 9 and 10 measurements were performed for each condition. Error bars represent the SEM. The effect of MTSET was statistically significant (P < 0.01) for each mutant in the E1 conformation condition versus WT. *, P < 0.05; **, P < 0.01, for the comparison between the E1 and E2 conformation for the same mutant. (B) Effects of MTSET at low concentrations. For each mutant, the effect of a concentration that resulted in approximately half of the maximum effect was tested in the presence of Na+ and K+. *, P < 0.05 for the comparison between the E1 and E2 conformation for the same mutant.
Figure 3.
Figure 3.
(A) Original current recordings in an oocyte expressing the W317C mutant of the α1 subunit of rat Na,K-ATPase. The holding membrane potential was kept at −50 mV, except for series of short voltage steps. The effect of MTSET was tested by measuring the K+-induced outward current before and after exposure to 250 μM MTSET for 2 min. The reversibility of the effect of MTSET was tested by measuring the K+-induced outward current before and after exposure to 10 mM DTT for 2 min. (B) Reversibility of the effect of MTSET. The effect of a reducing agent, dithiotreitol (DTT), was measured as described in the examples above. The bar graphs report that amplitude of the K+-activated current after MTSET exposure (2 min, 250 μM) and after subsequent DTT treatment (2 min, 10 mM). The current values are normalized in terms of the current measured under the initial control conditions. The DTT-induced recovery was complete the W317C mutant, but only partial in the E314C, Y315C, and I233C mutants. There were between five and seven measurements for each condition. Error bars represent the SEM.
Figure 4.
Figure 4.
Effect of MTSET on the voltage-dependent kinetics of activation by extracellular K+. The K+ concentration was increased in steps from 0 to 0.3, 1.0, 3.0, and 10 mM. MTSET was added at a concentration of 250 μM to the 10 mM K+ solution, and after a 2-min exposure, the K+-induced current was measured again by exposure to the same external K+ concentrations. I-V curves were recorded for each K+ concentration. The values of the K+-induced current at each concentration were used to calculate the maximum K+-induced current (Imax) and the K+ activation constant (K1/2K+), as described in MATERIALS AND METHODS. The K1/2K+ values were obtained by recording I-V curves in increasing K+ concentrations before and after exposure to MTSET. The five plots on the left represent the Imax and the five plots on the right the K1/2K+, as a function of the membrane potential for the WT (n = 10) and for four cysteine mutants, E314C (n = 10), Y315C (n = 9), W317C (n = 10), and I322C (n = 10). The curves with open symbols represent the measurements before MTSET perfusion, and those with the filled symbols represent the measurements after exposure to MTSET. The mean values measured in WT before MTSET treatment (open symbols in the top plot) are shown as a thick dashed line (without symbols or error bars) in the plots for each mutant for comparison. Error bars represent SEM. The error bars are smaller than the symbol size in some cases.
Figure 5.
Figure 5.
Effect of MTSET on the voltage-dependent kinetics of activation by extracellular K+ in a Na+-free solution. The K+ concentration was increased in steps from 0 to 0.05, 0.1, 0.2, and 5 mM. MTSET was added at a concentration of 250 μM to the 5 mM K+ solution, and after a 2-min exposure, the K+-induced current was measured again by exposure to the same external K+ concentrations. I-V curves were recorded for each K+ concentration. The values of the K+-induced current at each concentration were used to calculate the maximum K+-induced current (Imax), and the K+ activation constant (K1/2K+), as described in MATERIALS AND METHODS. The K1/2K+ values were obtained by recording I-V curves in increasing K+ concentrations before and after exposure to MTSET. The five plots on the left represent the Imax and the five plots on the right represent the K1/2K+ as a function of the membrane potential for the WT (n = 10) and for four cysteine mutants, E314C (n = 12), Y315C (n = 9), W317C (n = 10), and I322C (n = 11). The curves with open symbols represent the measurements before MTSET perfusion, and those with the filled symbols represent the measurements after exposure to MTSET. The mean values measured in WT before MTSET treatment (open symbols in the top plot) are shown as a thick dashed line (without symbols or error bars) in the plots for each mutant for comparison. Error bars represent SEM. The error bars are smaller than the symbol size in some cases.
Figure 6.
Figure 6.
The slow component of the ouabain-sensitive, presteady-state currents under Na+/Na+ exchange conditions was measured before and after exposure to MTSET in WT and mutant Na,K-ATPases. The panels on the left show the voltage dependence of the ouabain-sensitive presteady-state charge translocation (Q). The smooth curves correspond to the best fitting Boltzmann equation:formula imagewhere Q(V) is the charge displacement produced by the voltage step, Qmin the charge displaced at the maximum negative membrane potential, Qmax the maximum displaceable charge during a negative to positive potential jump, Vm the membrane potential, V 1/2 the midpoint potential, z the apparent valence, which was set to 1. F, R, and T have their usual meanings. The panels on the right show the voltage dependence of the relaxation rate of the slow component of the ouabain-sensitive presteady-state currents. The smooth curves show the best fitting curves corresponding to the following equation:formula imagewhich describes the voltage (V) dependence of the relaxation rate constant k as the sum of the forward and a backward voltage-sensitive rate constants with an effective charge z and values of k(0) and k′(0) at 0 mV, respectively. F, R, and T have their usual meanings. The curves with open symbols represent the measurements before MTSET perfusion, and those with the filled symbols represent the measurements after exposure to MTSET. The number of measurements was between four and eight. The mean values of Q and k, measured in WT before MTSET treatment (open symbols in the top plot), are shown as a thick dashed line (without symbols or error bars) in the plots for each mutant for comparison.
Figure 7.
Figure 7.
Structural model of the E1 and E2 states of the Na,K-ATPase built by homology with the 1SU4 and 1WPG structures of SERCA, respectively. The conformation of the loop was selected from among 500 conformers generated after clustering and effective energy calculation as detailed in MATERIALS AND METHODS section. The superposition was done on the fixed part of the TM domains between all the conformers. The distance between the helices in a given structure was calculated. We define one helix as being fixed relative to another if the distance considered is equal in all the structures (≤1.5 Å difference). Transmembrane segments (M1–M9) are indicated (in blue for E1 and in orange for E2). The M3–M4 hairpin is represented as thick ribbon representation with the side chains of the four residues studied in details (E1 dark blue, E2 red). The panel on the left shows a view parallel to the membrane plane (extracellular side up) from the position of the transmembrane segments M7–M10, which have been removed for clarity. The M5–M6 loop is transparent and its extracellular part has been removed for clarity. The large outward movement of I322 from the E1 to the E2 conformation can be observed. The panel on the right shows a view from the extracellular side of the membrane; the large movements of E314, Y315, and W317 from the E1 to the E2 conformation can be observed. The large extracellular loop between M7 and M8 has been removed. The side chain of residue T804, at the top of segment M6, is shown.

References

    1. Apell, H.-J., and S.J.D. Karlish. 2001. Functional properties of Na,K-ATPase, and their structural implications, as detected with biophysical techniques. J. Membr. Biol. 180:1–9. - PubMed
    1. Artigas, P., N. Reyes, and D.C. Gadsby. 2005. Na,K-ATPase ion translocation pathway. J. Gen. Physiol. 126:4A (Abstr.).
    1. Brooks, B.R., R.E. Bruccoleri, B.D. Olafson, D.J. States, S. Swaminathan, and M. Karplus. 1983. Charmm-a program for macromolecular energy, minimization, and dynamics calculations. J. Comput. Chem. 4:187–217.
    1. Canessa, C.M., J.-D. Horisberger, and B.C. Rossier. 1993. Mutation of a tyrosine in the H3-H4 ectodomain of Na,K-ATPase confers ouabain resistance. J. Biol. Chem. 268:17722–17726. - PubMed
    1. Capendeguy, O., and J.-D. Horisberger. 2005. The role of the third extracellular loop of the Na,K-ATPase α subunit in a luminal gating mechanism. J. Physiol. 565:207–218. - PMC - PubMed

Publication types

MeSH terms

Substances