

X-ray diffraction "fingerprinting" of DNA structure in solution for quantitative evaluation of molecular dynamics simulation
- PMID: 16505363
- PMCID: PMC1383498
- DOI: 10.1073/pnas.0600022103
X-ray diffraction "fingerprinting" of DNA structure in solution for quantitative evaluation of molecular dynamics simulation
Abstract
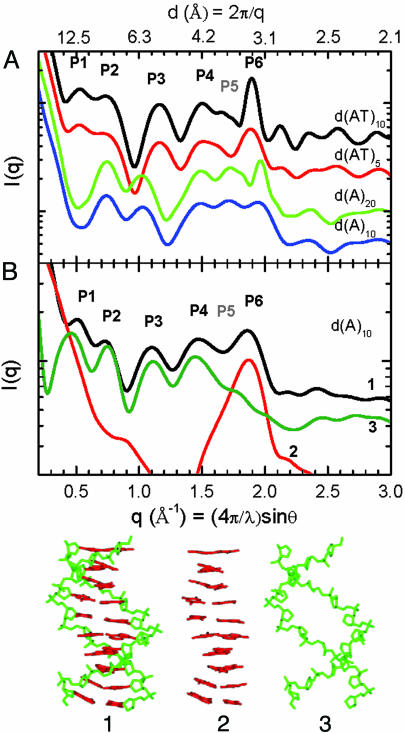
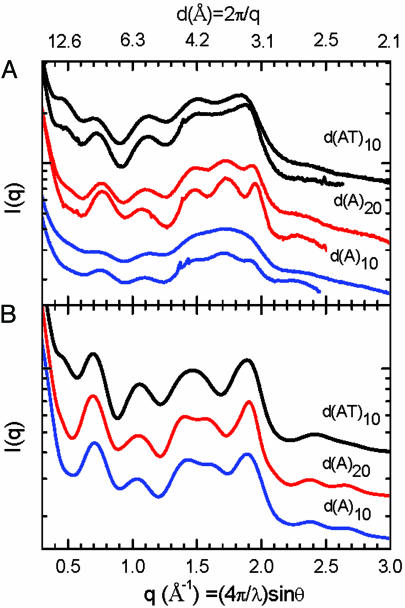
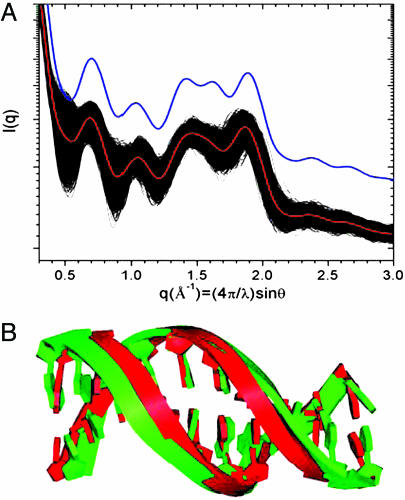
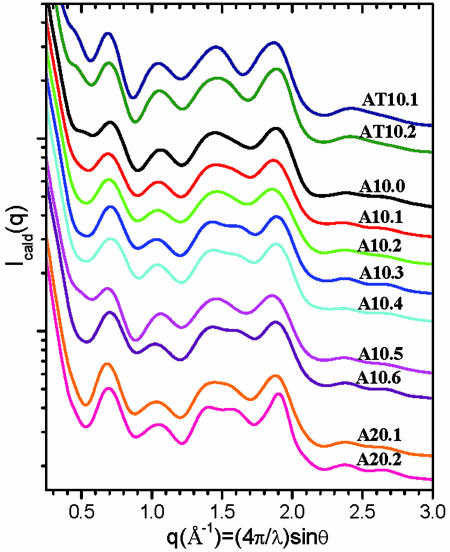
Solution state x-ray diffraction fingerprinting is demonstrated as a method for experimentally assessing the accuracy of molecular dynamics (MD) simulations. Fourier transforms of coordinate data from MD simulations are used to produce reciprocal space "fingerprints" of atomic pair distance correlations that are characteristic of the ensemble and are the direct numerical analogues of experimental solution x-ray diffraction (SXD). SXD experiments and MD simulations were carried out to test the ability of experiment and simulation to resolve sequence-dependent modifications in helix conformation for B-form DNA. SXD experiments demonstrated that solution-state poly(AT) and poly(A)-poly(T) duplex DNA sequences exist in ensembles close to canonical B-form and B'-form structures, respectively. In contrast, MD simulations analyzed in terms of SXD fingerprints are shown to deviate from experiment, most significantly for poly(A)-poly(T) duplex DNA. Compared with experiment, MD simulation shortcomings were found to include both mismatches in simulated conformer structures and number population within the ensembles. This work demonstrates an experimental approach for quantitatively evaluating MD simulations and other coordinate models to simulate biopolymer structure in solution and suggests opportunities to use solution diffraction data as experimental benchmarks for developing supramolecular force fields optimized for a range of in situ applications.
Conflict of interest statement
Conflict of interest statement: No conflicts declared.
Figures
References
-
- Barnett R. N., Cleveland C. L., Joy A., Landman U., Schuster G. B. Science. 2001;294:567–571. - PubMed
-
- Cheatham T. E. Curr. Opin. Struct. Biol. 2004;14:360–367. - PubMed
-
- Cheatham T. E., Young M. A. Biopolymers. 2001;56:232–256. - PubMed
-
- Beveridge D. L., Dixit S. B., Barreiro G., Thayer K. M. Biopolymers. 2004;73:380–403. - PubMed
Publication types
MeSH terms
Substances
Grants and funding
LinkOut - more resources
Full Text Sources
Other Literature Sources
