

Determination of strongly overlapping signaling activity from microarray data
- PMID: 16507110
- PMCID: PMC1413561
- DOI: 10.1186/1471-2105-7-99
Determination of strongly overlapping signaling activity from microarray data
Abstract
Background: As numerous diseases involve errors in signal transduction, modern therapeutics often target proteins involved in cellular signaling. Interpretation of the activity of signaling pathways during disease development or therapeutic intervention would assist in drug development, design of therapy, and target identification. Microarrays provide a global measure of cellular response, however linking these responses to signaling pathways requires an analytic approach tuned to the underlying biology. An ongoing issue in pattern recognition in microarrays has been how to determine the number of patterns (or clusters) to use for data interpretation, and this is a critical issue as measures of statistical significance in gene ontology or pathways rely on proper separation of genes into groups.
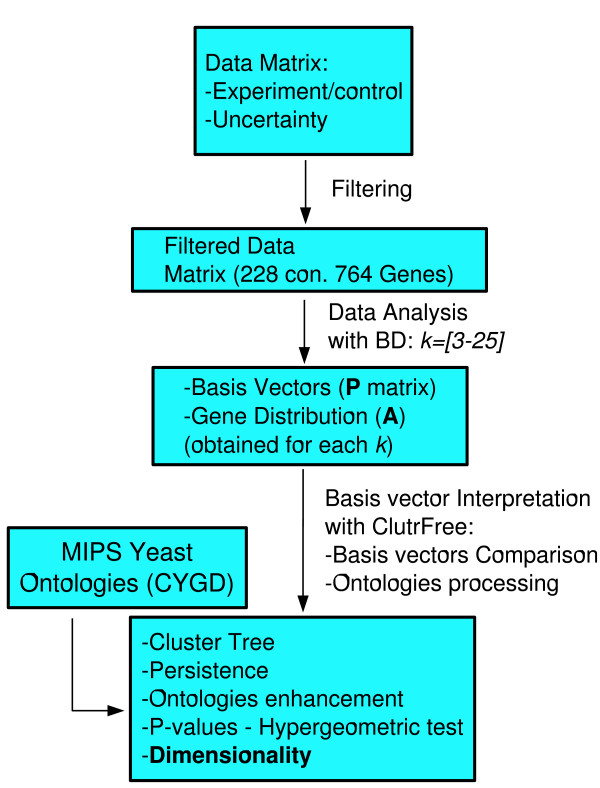
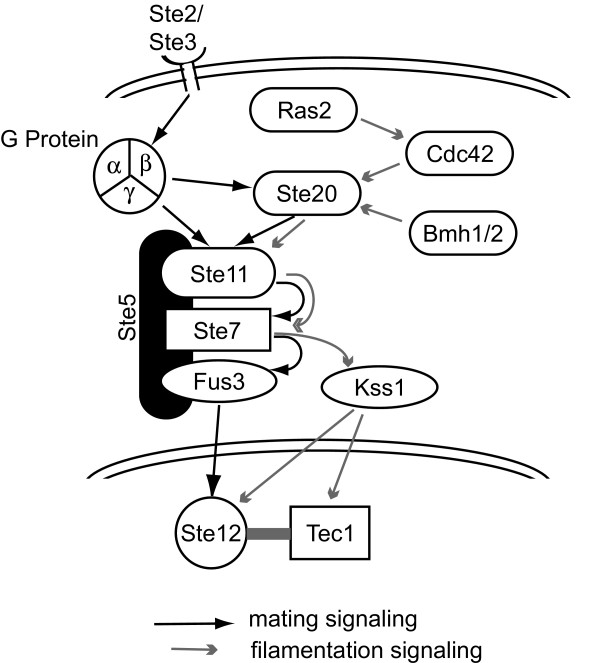
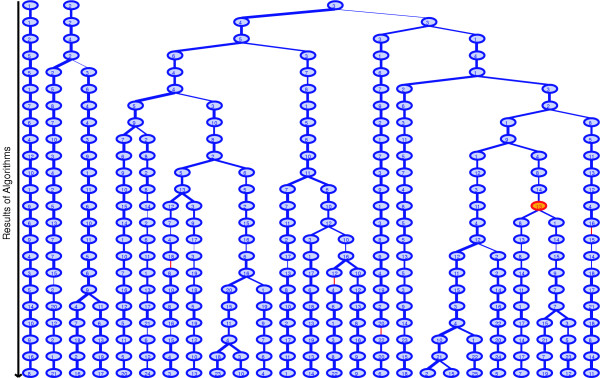
Results: Here we introduce a method relying on gene annotation coupled to decompositional analysis of global gene expression data that allows us to estimate specific activity on strongly coupled signaling pathways and, in some cases, activity of specific signaling proteins. We demonstrate the technique using the Rosetta yeast deletion mutant data set, decompositional analysis by Bayesian Decomposition, and annotation analysis using ClutrFree. We determined from measurements of gene persistence in patterns across multiple potential dimensionalities that 15 basis vectors provides the correct dimensionality for interpreting the data. Using gene ontology and data on gene regulation in the Saccharomyces Genome Database, we identified the transcriptional signatures of several cellular processes in yeast, including cell wall creation, ribosomal disruption, chemical blocking of protein synthesis, and, critically, individual signatures of the strongly coupled mating and filamentation pathways.
Conclusion: This works demonstrates that microarray data can provide downstream indicators of pathway activity either through use of gene ontology or transcription factor databases. This can be used to investigate the specificity and success of targeted therapeutics as well as to elucidate signaling activity in normal and disease processes.
Figures


Similar articles
-
Connectivity in the yeast cell cycle transcription network: inferences from neural networks.PLoS Comput Biol. 2006 Dec 22;2(12):e169. doi: 10.1371/journal.pcbi.0020169. Epub 2006 Oct 30. PLoS Comput Biol. 2006. PMID: 17194216 Free PMC article.
-
A new dynamic Bayesian network (DBN) approach for identifying gene regulatory networks from time course microarray data.Bioinformatics. 2005 Jan 1;21(1):71-9. doi: 10.1093/bioinformatics/bth463. Epub 2004 Aug 12. Bioinformatics. 2005. PMID: 15308537
-
Network constrained clustering for gene microarray data.Bioinformatics. 2005 Nov 1;21(21):4014-20. doi: 10.1093/bioinformatics/bti655. Epub 2005 Sep 1. Bioinformatics. 2005. PMID: 16141248
-
Bayesian decomposition: analyzing microarray data within a biological context.Ann N Y Acad Sci. 2004 May;1020:212-26. doi: 10.1196/annals.1310.018. Ann N Y Acad Sci. 2004. PMID: 15208194 Review.
-
Pathways to the analysis of microarray data.Trends Biotechnol. 2005 Aug;23(8):429-35. doi: 10.1016/j.tibtech.2005.05.011. Trends Biotechnol. 2005. PMID: 15950303 Review.
Cited by
-
CoGAPS: an R/C++ package to identify patterns and biological process activity in transcriptomic data.Bioinformatics. 2010 Nov 1;26(21):2792-3. doi: 10.1093/bioinformatics/btq503. Epub 2010 Sep 1. Bioinformatics. 2010. PMID: 20810601 Free PMC article.
-
Matrix factorization for recovery of biological processes from microarray data.Methods Enzymol. 2009;467:59-77. doi: 10.1016/S0076-6879(09)67003-8. Methods Enzymol. 2009. PMID: 19897089 Free PMC article.
-
Gene expression signatures modulated by epidermal growth factor receptor activation and their relationship to cetuximab resistance in head and neck squamous cell carcinoma.BMC Genomics. 2012 May 1;13:160. doi: 10.1186/1471-2164-13-160. BMC Genomics. 2012. PMID: 22549044 Free PMC article.
-
Bayesian network expansion identifies new ROS and biofilm regulators.PLoS One. 2010 Mar 3;5(3):e9513. doi: 10.1371/journal.pone.0009513. PLoS One. 2010. PMID: 20209085 Free PMC article.
-
Mass-spectrometry-based metabolomics: limitations and recommendations for future progress with particular focus on nutrition research.Metabolomics. 2009 Dec;5(4):435-458. doi: 10.1007/s11306-009-0168-0. Epub 2009 Jun 12. Metabolomics. 2009. PMID: 20046865 Free PMC article.
References
-
- Mauro MJ, Druker BJ. STI571: targeting BCR-ABL as therapy for CML. Oncologist. 2001;6:233–8. - PubMed
-
- Repka T, Chiorean EG, Gay J, Herwig KE, Kohl VK, Yee D, Miller JS. Trastuzumab and interleukin-2 in HER2-positive metastatic breast cancer: a pilot study. Clin Cancer Res. 2003;9:2440–6. - PubMed
-
- von Mehren M. Recent advances in the management of gastrointestinal stromal tumors. Curr Oncol Rep. 2003;5:288–94. - PubMed
-
- Jacks T, Weinberg RA. Taking the study of cancer cell survival to a new dimension. Cell. 2002;111:923–5. - PubMed
Publication types
MeSH terms
Substances
Grants and funding
LinkOut - more resources
Full Text Sources
Molecular Biology Databases
Research Materials
