Comparative Study
. 2006 May 16;25(3):375-86.
doi: 10.1152/physiolgenomics.00223.2005. Epub 2006 Feb 28.

Ischemic and nephrotoxic acute renal failure are distinguished by their broad transcriptomic responses

Affiliations
Comparative Study

Ischemic and nephrotoxic acute renal failure are distinguished by their broad transcriptomic responses

Peter S T Yuen et al. Physiol Genomics. .

Abstract

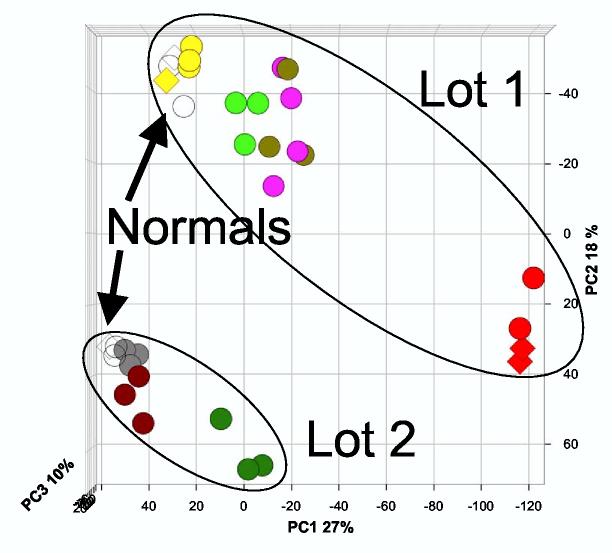
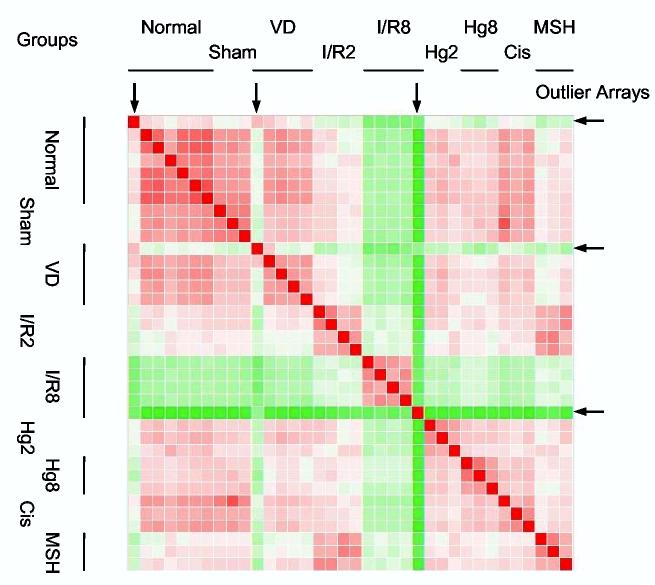
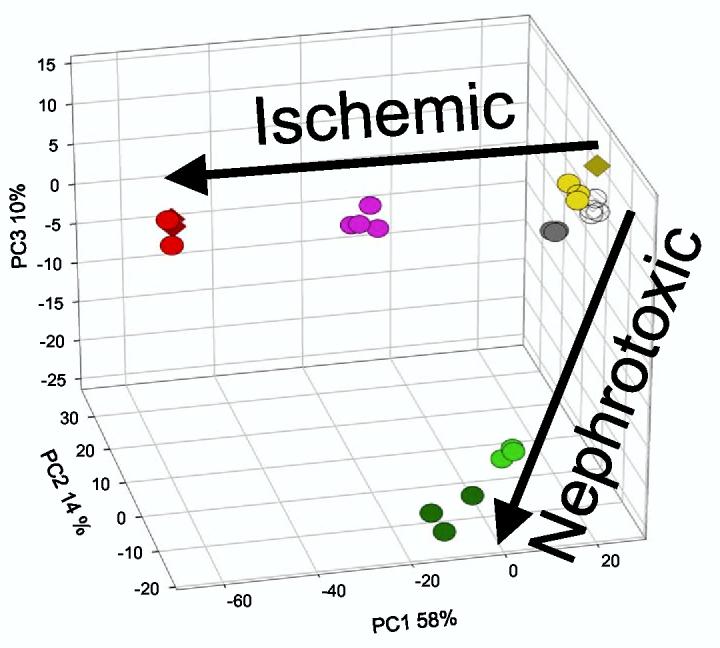
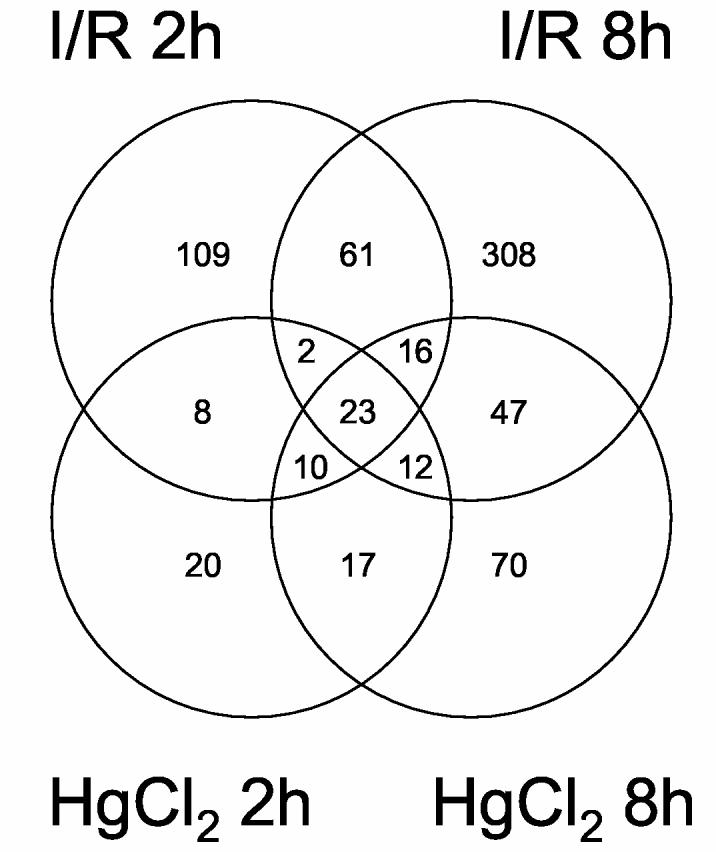
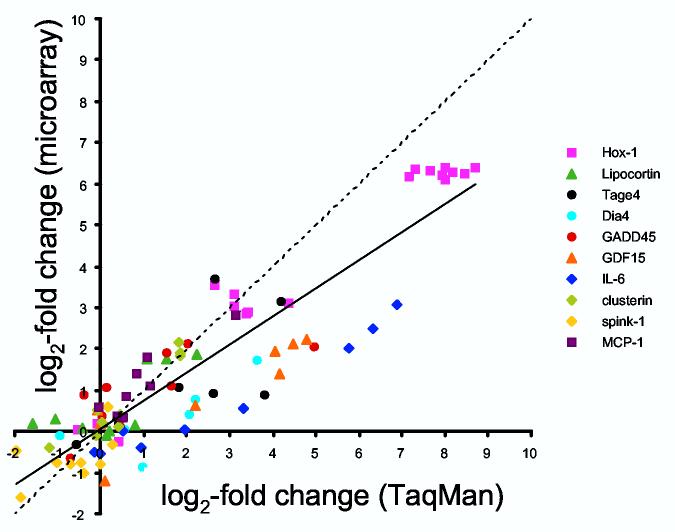
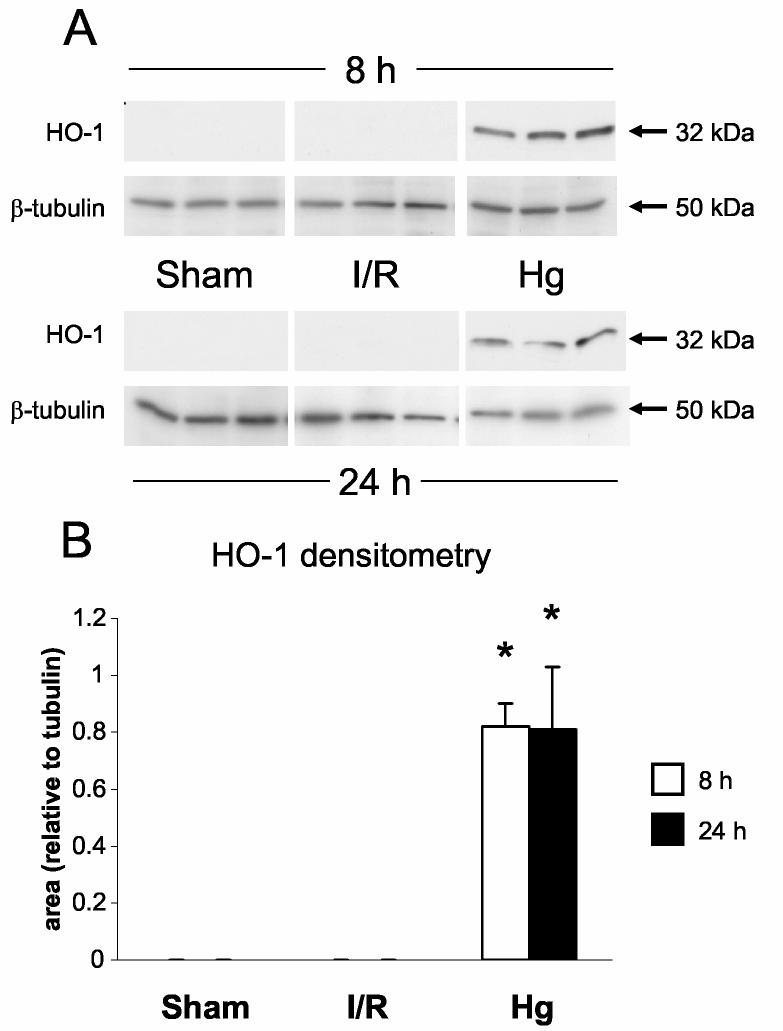
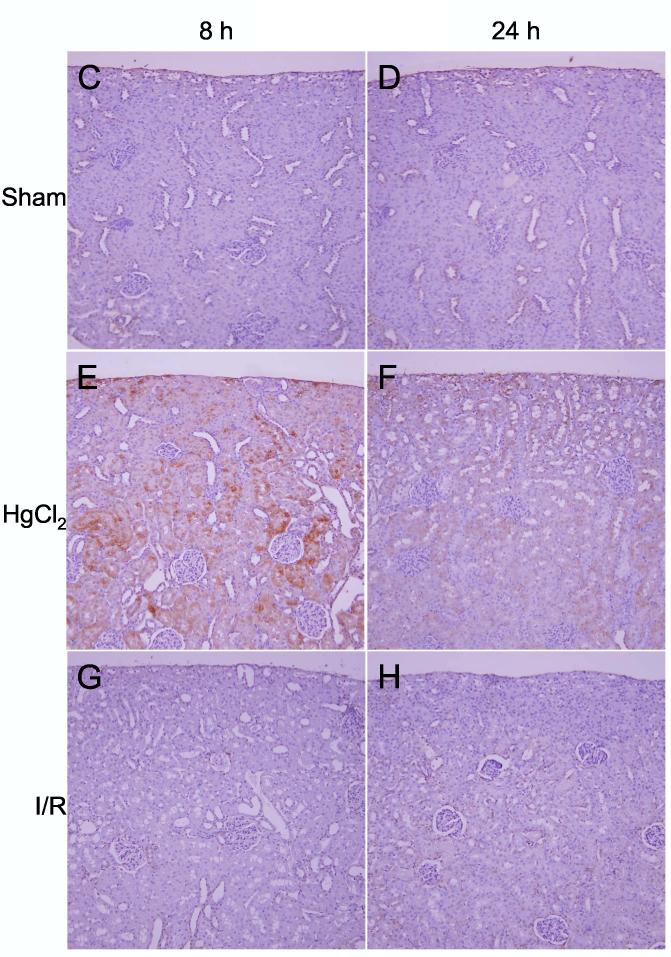
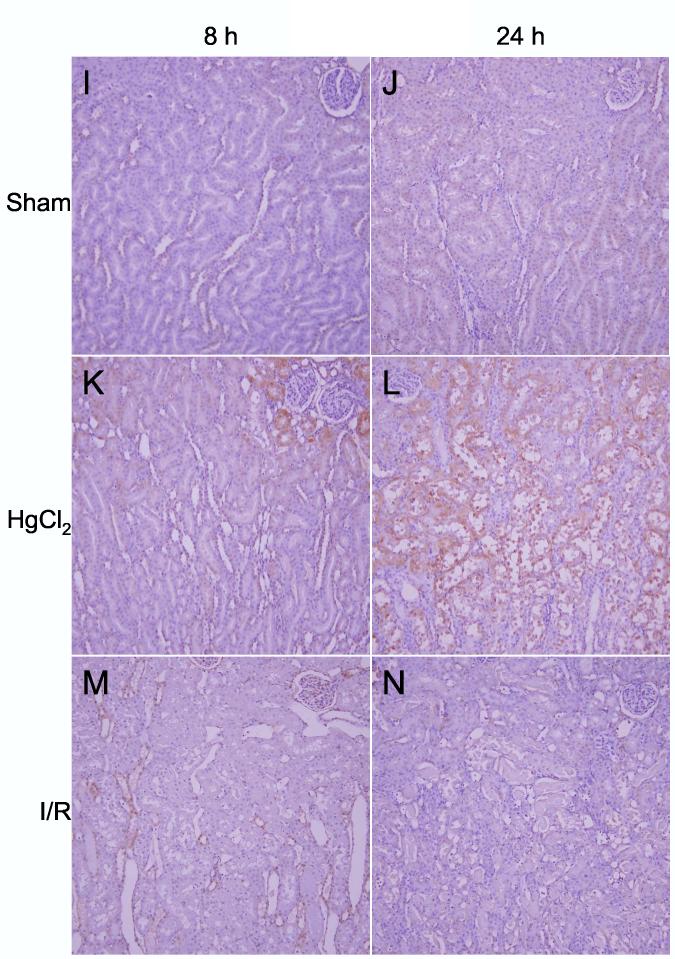
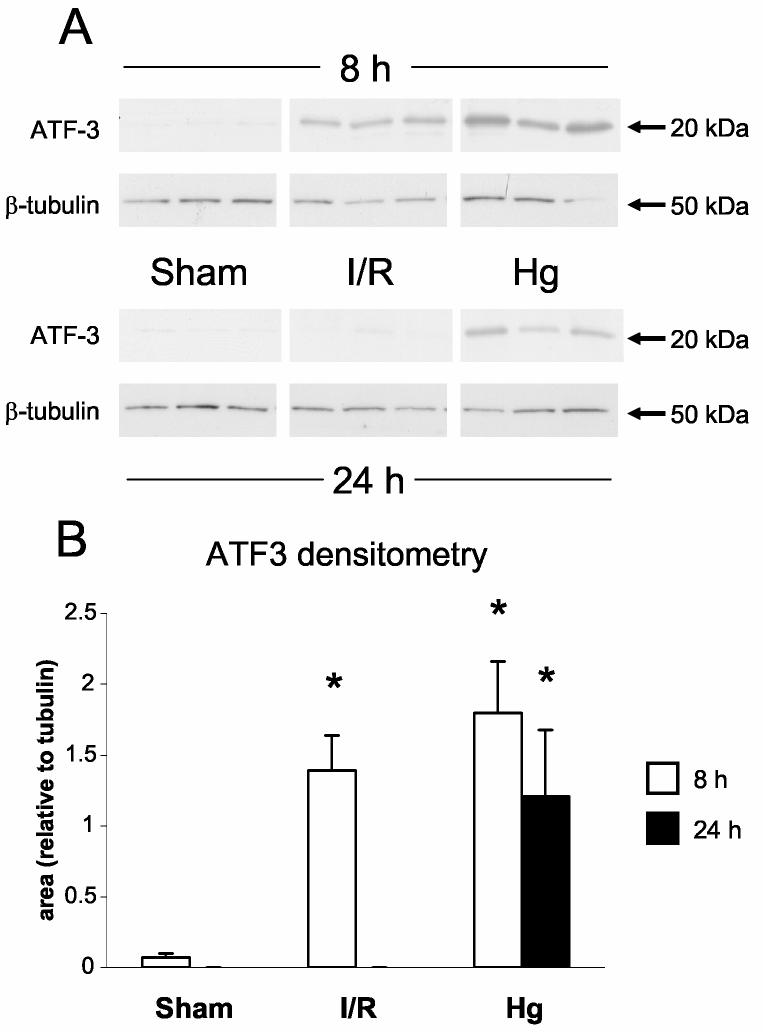
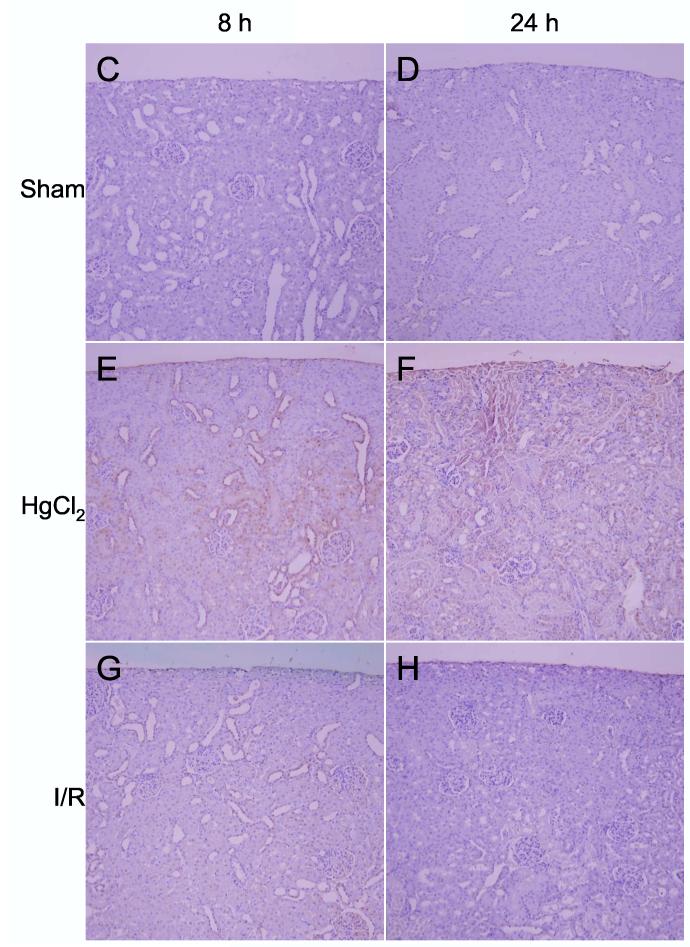
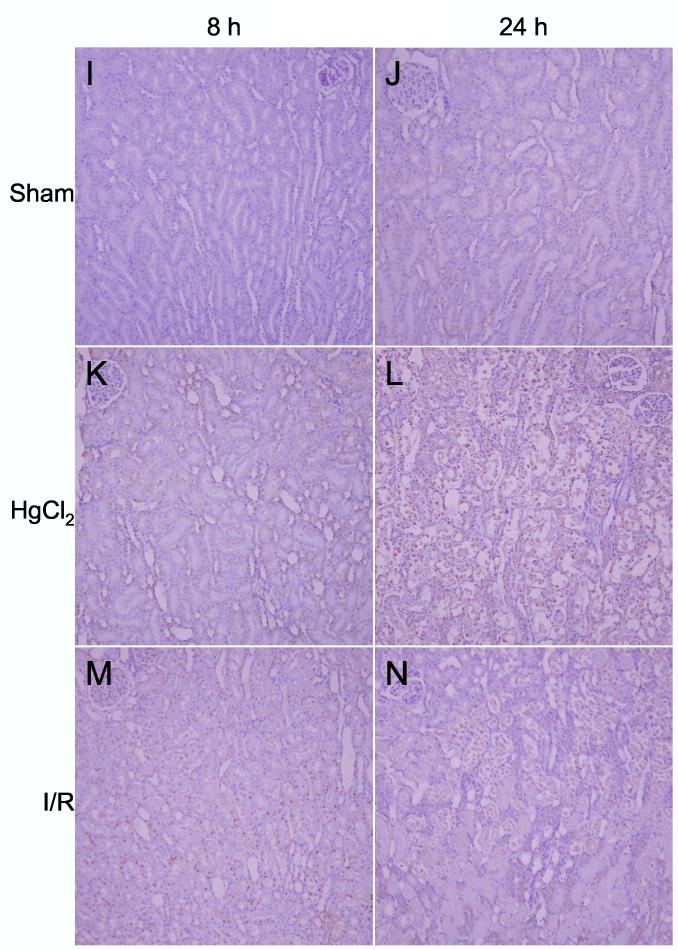
Acute renal failure (ARF) has a high morbidity and mortality. In animal ARF models, effective treatments must be administered before or shortly after the insult, limiting their clinical potential. We used microarrays to identify early biomarkers that distinguish ischemic from nephrotoxic ARF or biomarkers that detect both injury types. We compared rat kidney transcriptomes at 2 and 8 h after ischemia/reperfusion and after mercuric chloride. Quality control and statistical analyses were necessary to normalize microarrays from different lots, eliminate outliers, and exclude unaltered genes. Principal component analysis revealed distinct ischemic and nephrotoxic trajectories and clear array groupings. Therefore, we used supervised analysis, t-tests, and fold changes to compile gene lists for each group, exclusive or nonexclusive, alone or in combination. There was little network connectivity, even in the largest group. Some microarray-identified genes were validated by TaqMan assay, ruling out artifacts. Western blotting confirmed that heme oxygenase-1 (HO-1) and activating transcription factor-3 (ATF3) proteins were upregulated; however, unexpectedly, their localization changed within the kidney. HO-1 staining shifted from cortical (early) to outer stripe of the outer medulla (late), primarily in detaching cells, after mercuric chloride but not ischemia/reperfusion. ATF3 staining was similar, but with additional early transient expression in the outer stripe after ischemia/reperfusion. We conclude that microarray-identified genes must be evaluated not only for protein levels but also for anatomical distribution among different zones, nephron segments, or cell types. Although protein detection reagents are limited, microarray data lay a rich foundation to explore biomarkers, therapeutics, and the pathophysiology of ARF.


Figures

Figure 1
Figure 1
Principal Component Analysis of median centered microarrays from two microarray hybridizations/lots. Median-centered microarray intensity values for 9251 genes were log2 transformed and PCA was performed by Partek Pro. Biological groups are denoted by different colors, and normals are open circles. The first principal component (PC1) accounted for 27% of the variation, PC2 accounted for 18% of the variation, and PC3 accounted for 10% of the variation. Only normal rats were analyzed in both hybridizations/lots. Biological groups are denoted by the following colors: normal, white; volume depletion, yellow; sham, gray; ischemia/reperfusion 2h, purple; ischemia/reperfusion 8h, red; mercuric chloride 2h, light green; mercuric chloride 8h, dark green. Duplicates (RNA from one rat is hybridized to two microarrays) are denoted by diamonds.
Figure 2
Figure 2
Dissimilarity matrix (Euclidian distance heatmap) after lot normalization of microarrays with the mean microarray intensity of the normal groups for each microarray experiment/lot. Red squares depict similarity, and green squares depict dissimilarity. Arrows indicate outlier microarrays that were subsequently removed from the dataset.
Figure 3
Figure 3
Principal Component Analysis of genes filtered by one-way ANOVA. The cutoff for gene selection was set at p < 0.001 using the Dunn-Sidak correction (uncorrected p-values were < 10−7). The three-dimensional plot was rotated to highlight the ischemic and nephrotoxic trajectories. The first principal component (PC1) accounted for 58% of the variation, PC2 accounted for 14% of the variation, and PC3 accounted for 10% of the variation. Symbols are the same as in Fig. 1.
Figure 4
Figure 4
Venn Diagram of t-test results. Data was filtered by one-way ANOVA with a cutoff of p < 0.05 using the Dunn-Sidak correction (leaving 1,596 genes), followed by t-tests with cutoffs of mean 2-fold change and p < 0.01, using a multiple comparison correction. Two overlapping areas could not be shown graphically: 21 genes restricted to mercuric chloride 8 h and ischemia/reperfusion 2 h; and 4 genes restricted to mercuric chloride 2 h and ischemia/reperfusion 8 h.
Figure 5
Figure 5
Validation of gene expression by real-time RT-PCR (TaqMan). Ten genes were chosen for relevance to ARF, known intron-exon boundaries, and range of gene expression levels. Median-centered, lot normalized microarray intensities and gene expression levels relative to 18S rRNA were both log2-transformed and expressed as log2 differences from normal. The line of equivalence is dashed, and the line of correlation is solid (slope = 0.681, intercept = 0.060, r = 0.91).
Figure 6
Figure 6
Detection of heme oxygenase-1 protein. A: Western blots of HO-1 and β-tubulin in kidneys from sham, ischemia/reperfusion injury, and mercuric chloride-treated rats sacrificed at 8 or 24 h post-insult. HO-1 is depicted in the upper panels, and β-tubulin (after stripping and reprobing of membranes) is depicted in lower panels (n = 3 rats). B: Densitometry of western blots in panel A, normalized for β-tubulin, open bars: 8 h, closed bars: 24 h. *p < 0.05, n = 3 rats. C-N: Immunohistochemistry of HO-1 (all images are oriented with the exterior of the kidney at the top) in cortex (C-H) outer stripe of the outer medulla (I-N). C,I: sham 8 h; D,J: sham 24 h; E,K: mercuric chloride 8 h; F,L: mercuric chloride 24 h; G,M: ischemia/reperfusion 8 h; H,N: ischemia/reperfusion 24 h.
Figure 6
Figure 6
Detection of heme oxygenase-1 protein. A: Western blots of HO-1 and β-tubulin in kidneys from sham, ischemia/reperfusion injury, and mercuric chloride-treated rats sacrificed at 8 or 24 h post-insult. HO-1 is depicted in the upper panels, and β-tubulin (after stripping and reprobing of membranes) is depicted in lower panels (n = 3 rats). B: Densitometry of western blots in panel A, normalized for β-tubulin, open bars: 8 h, closed bars: 24 h. *p < 0.05, n = 3 rats. C-N: Immunohistochemistry of HO-1 (all images are oriented with the exterior of the kidney at the top) in cortex (C-H) outer stripe of the outer medulla (I-N). C,I: sham 8 h; D,J: sham 24 h; E,K: mercuric chloride 8 h; F,L: mercuric chloride 24 h; G,M: ischemia/reperfusion 8 h; H,N: ischemia/reperfusion 24 h.
Figure 7
Figure 7
Detection of activating transcription factor-3 protein (ATF3). A: Western blots of ATF3 and β-tubulin in kidneys from sham, ischemia/reperfusion injury, and mercuric chloride-treated rats sacrificed at 8 or 24 h post-insult. ATF-3 is depicted in the upper panels, and β-tubulin (after stripping and reprobing of membranes) is depicted in lower panels (n = 3 rats). B: Densitometry of western blots in panel A, normalized for β-tubulin, open bars: 8 h, closed bars: 24 h. *p < 0.05, n = 3 rats. C-N: Immunohistochemistry of ATF-3, same as in Figure 6.
Figure 7
Figure 7
Detection of activating transcription factor-3 protein (ATF3). A: Western blots of ATF3 and β-tubulin in kidneys from sham, ischemia/reperfusion injury, and mercuric chloride-treated rats sacrificed at 8 or 24 h post-insult. ATF-3 is depicted in the upper panels, and β-tubulin (after stripping and reprobing of membranes) is depicted in lower panels (n = 3 rats). B: Densitometry of western blots in panel A, normalized for β-tubulin, open bars: 8 h, closed bars: 24 h. *p < 0.05, n = 3 rats. C-N: Immunohistochemistry of ATF-3, same as in Figure 6.

Similar articles

Cited by

References

    1. Alam J, Killeen E, Gong P, Naquin R, Hu B, Stewart D, Ingelfinger JR, Nath KA. Heme activates the heme oxygenase-1 gene in renal epithelial cells by stabilizing Nrf2. Am J Physiol Renal Physiol. 2003;284:F743–752. - PubMed
    1. Amin RP, Vickers AE, Sistare F, Thompson KL, Roman RJ, Lawton M, Kramer J, Hamadeh HK, Collins J, Grissom S, Bennett L, Tucker CJ, Wild S, Kind C, Oreffo V, Davis JW, 2nd, Curtiss S, Naciff JM, Cunningham M, Tennant R, Stevens J, Car B, Bertram TA, Afshari CA. Identification of putative gene based markers of renal toxicity. Environ Health Perspect. 2004;112:465–479. - PMC - PubMed
    1. Bland JM, Altman DG. Statistical methods for assessing agreement between two methods of clinical measurement. Lancet. 1986;1:307–310. - PubMed
    1. Bock C, Coleman M, Collins B, Davis J, Foulds G, Gold L, Greef C, Heil J, Heilig JS, Hicke B, Hurst MN, Husar GM, Miller D, Ostroff R, Petach H, Schneider D, Vant-Hull B, Waugh S, Weiss A, Wilcox SK, Zichi D. Photoaptamer arrays applied to multiplexed proteomic analysis. Proteomics. 2004;4:609–618. - PubMed
    1. Brooks HL, Ageloff S, Kwon TH, Brandt W, Terris JM, Seth A, Michea L, Nielsen S, Fenton R, Knepper MA. cDNA array identification of genes regulated in rat renal medulla in response to vasopressin infusion. Am J Physiol Renal Physiol. 2003;284:F218–228. - PubMed

Publication types

MeSH terms