. 2006 Mar;26(6):2080-92.
doi: 10.1128/MCB.26.6.2080-2092.2006.

Inflammatory disease and lymphomagenesis caused by deletion of the Myc antagonist Mnt in T cells

Affiliations

Inflammatory disease and lymphomagenesis caused by deletion of the Myc antagonist Mnt in T cells

Shala Dezfouli et al. Mol Cell Biol. 2006 Mar.

Abstract

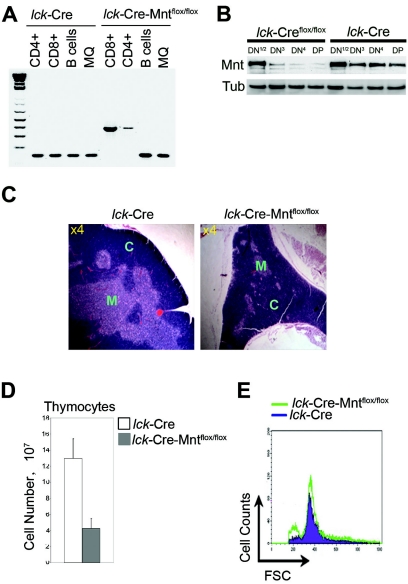
Mnt is a Max-interacting protein that can antagonize the activities of Myc oncoproteins in cultured cells. Mnt null mice die soon after birth, but conditional deletion of Mnt in breast epithelium leads to tumor formation. These and related data suggest that Mnt functions as a tumor suppressor. Here we show that conditional deletion of Mnt in T cells leads to tumor formation but also causes inflammatory disease. Deletion of Mnt caused increased apoptosis of thymic T cells and interfered with T-cell development yet led to spleen, liver, and lymph node enlargement. The proportion of T cells in the spleen and lymph nodes was reduced, and the numbers of cells in non-T-cell immune cell populations were elevated. The disruption of immune homeostasis is linked to a strong skewing toward production of T-helper 1 (Th1) cytokines and enhanced proliferation of activated Mnt-deficient CD4+ T cells. Consistent with Th1 polarization in vivo, extensive intestinal inflammation and liver necrosis developed. Finally, most mice lacking Mnt in T cells ultimately succumbed to T-cell lymphoma. These results strengthen the argument that Mnt functions as a tumor suppressor and reveal a critical and surprising role for Mnt in the regulation of T-cell development and in T-cell-dependent immune homeostasis.


Figures

FIG. 1.
FIG. 1.
Deletion of Mnt in T cells causes decreased thymic cellularity. (A) PCR genotyping performed on DNA obtained from FACS-sorted thymic CD4+ and CD8+ T cells, splenic B220+ B cells, and F4/80+ macrophages from mice of the indicated genotypes at 8 weeks of age. The 160-bp PCR product is diagnostic for the wild-type Mnt allele, and the 350-bp PCR product is diagnostic for the mutant allele. (B) Western blot analysis of Mnt expression in DN subsets obtained from lck-Cre Mntflox/flox and lck-Cre mice. DN T cells were enriched from total thymocytes isolated from multiple 5-week-old littermates by first removing populations staining with antibodies against CD3, CD4, CD8, GR1, Mac1, and B220. DN T cells were then sorted by flow cytometry for CD25 and CD44 to isolate the different DN subsets. The DN1 and DN2 populations were pooled because of their relatively low numbers. Tub, tubulin. (C) Hematoxylin-and-eosin-stained thymus sections. The inner medulla (M) region of the lck-Cre Mntflox/flox thymus was markedly reduced relative to the cortex (C). Magnification (n-fold) is indicated. (D) Comparison of total thymocyte numbers from lck-Cre-Mntflox/flox mice (n = 5) and age-matched (5- to 9-week-old) control mice (n = 6). Values shown are means ± standard deviations (P = 0.005). (E) Cell size comparison of total thymocytes determined by FSC.
FIG. 2.
FIG. 2.
Differentiation and proliferation defects in Mnt-deficient thymocytes. (A) Total thymocytes isolated from littermates (5 to 9 weeks old) with the indicated genotypes were enriched for DN T cells as described in the legend to Fig. 1B and analyzed for CD25 and CD44 expression by flow cytometry. The value in each quadrant represents the percentage of cells in one of the four DN populations (indicated in the lck-Cre half of the panel). Note the accumulation of thymocytes from lck-Cre-Mntflox/flox mice in the CD25+ CD44 population (DN III). The results shown are representative of six independent experiments. (B) Representative flow cytometry profiles of thymocytes from lck-Cre-Mntflox/flox and littermate control mice stained with antibodies against CD4+ and CD8+. Values indicate the percentages of cells of the different T-cell subsets. (C) The absolute numbers of thymocytes representing the indicated developmental stages were calculated from FACS data and total cell numbers compiled from four independent experiments. Data are shown as means ± standard deviations (*, P = 0.03; **, P = 0.02; ***, P = 0.02). DN populations were not significantly different.
FIG. 3.
FIG. 3.
Increased proliferation and apoptosis caused by deletion of Mnt. (A) Total thymocytes from lck-Cre and lck-Cre-Mntflox/flox mice were gated for live cells, stained with monoclonal antibodies to CD4 and CD8, fixed, and stained with 4′,6′-diamidino-2-phenylindole (DAPI) for cell cycle analysis by FACS based on DNA content. Percent S phase is indicated on representative histograms (n = 3), and the table to the right shows mean values with standard deviations. (B) Increased apoptosis in mature thymocytes from lck-Cre-Mntflox/flox mice. Total thymocytes were stained for CD4, CD8, and annexin V, and representative histograms (n = 3) comparing annexin V-positive staining of the indicated sorted thymocyte subpopulations are shown. Numbers in each histogram represent the percentage of annexin V-positive populations in each group. The table shows mean values and standard deviations (*, P = 0.03; **, P = 0.04). CD4 apoptosis was not significantly different.
FIG. 4.
FIG. 4.
Thymocyte expression of proteins and genes regulated by Myc. (A) Western blot analysis of c-Myc, N-Myc, and several Myc effector proteins. Lysates from total thymocytes isolated from lck-Cre, lck-Cre-Mntflox/+, and lck-Cre-Mntflox/flox mice were immunoblotted with antibodies against the indicted proteins. (B) Quantitative RT-PCR analysis of Mnt and several Myc target genes in thymocytes from lck-Cre-Mntflox/flox mice and control lck-Cre mice. The n-fold change in gene expression in thymocytes of lck-Cre-Mntflox/flox mice was determined by comparing acidic ribosomal phosphoprotein (Arbp) PO-normalized gene expression levels in thymocytes of lck-Cre-Mntflox/flox and lck-Cre mice. RT-PCR was performed in triplicate on samples obtained from two different mice for each genotype. Standard deviations are shown.
FIG. 5.
FIG. 5.
Splenomegaly and lymphadenopathy in lck-Cre-Mntflox/flox mice. (A) Spleens from 12-month-old lck-Cre-Mntflox/flox and lck-Cre-Mntflox/+ littermates. (B) Hematoxylin-and-eosin-stained sections from the spleens shown in panel A. (C) Gross enlargement of sublumbar lymph node in a lck-Cre-Mntflox/flox mouse. (D) Widespread expression of the mitosis marker phosphorylated histone H3 in spleens of lck-Cre-Mntflox/flox mice. (E) Representative (n = 4) FACS profiles of CD4+ CD3+ and CD8+ CD3+ populations in total splenocytes from lck-Cre-Mntflox/flox and lck-Cre-Mntflox/+ littermates. Note the relative increase in the percentage of triple-negative cells (cells lacking CD4 and CD8 [lower left quadrant]) representing non-T-cell (NT) populations. Values indicate percentages of the different populations. (F) Absolute numbers of cells in different splenic subpopulations calculated from FACS data and estimated total splenocyte numbers (after red blood cell lysis) determined from four independent experiments. Values are means ± standard deviations (*, P = 0.02; **, P = 0.02).
FIG. 6.
FIG. 6.
Th1 polarization and increased proliferation of CD4+ splenocytes lacking Mnt. (A) FACS-sorted CD4+ splenocytes were stimulated with PMA and ionomycin for 48 h, and concentrations of Th1 cytokines (IL-2, IFN-γ, and TNF-α) and Th2 cytokines (IL-4 and IL-5) were determined by enzyme-linked immunosorbent assay. (B) Analysis of proliferation by CFSE dilution following PMA and ionomycin stimulation (for 2 and 3 days) of CD4+ splenocytes isolated from 3- to 5-month-old lck-Cre-Mntflox/flox and lck-Cre littermates. Untreated parental populations of lck-Cre and lck-Cre-Mntflox/flox mouse-derived thymocytes had identical profiles (lck-Cre mouse thymocytes are shown). The appearance of different-color peaks represents successive cell divisions. Representative histograms are shown. (C) Cell size (FSC) analysis of CD4+ splenocytes purified from lck-Cre and lck-Cre-Mntflox/flox littermates before and 48 h after stimulation with PMA and ionomycin. (D) Annexin V staining of the same cells as shown in panel C. Percentages of apoptotic cells are shown.
FIG. 7.
FIG. 7.
Intestinal inflammation and liver damage in lck-Cre-Mntflox/flox mice. (A) Representative livers of lck-Cre-Mntflox/+ and lck-Cre-Mntflox/flox mice at 12 months of age. Note darkened regions consistent with necrosis. (B) Prussian blue staining of liver sections from lck-Cre-Mntflox/+ and lck-Cre-Mntflox/flox mice. Prussian blue stains iron-containing cells and indicates the presence of hemosiderin-containing macrophages (blue staining). The dark pink staining in lck-Cre-Mntflox/flox liver (arrow) shows the patchwork of infiltrating lymphocytes. (C) Hematoxylin-and-eosin-stained sections of the small intestine (jejunum) from lck-Cre-Mntflox/+ and lck-Cre-Mntflox/flox mice at 12 months of age. Note the granulomatous inflammation (arrow) in the intestine of a lck-Cre-Mntflox/flox mice. The asterisks show the location of crypts at the base of the villi. The lower panel shows ×40 magnification of granulomatous tissue featuring multinucleated giant cells (arrow). (D) Prussian blue staining of granulomatous tissue at ×4 and ×40 magnifications.
FIG. 8.
FIG. 8.
Loss of Mnt predisposes to lymphomagenesis. (A) Survival curves of lck-Cre-Mntflox/+ and lck-Cre-Mntflox/flox mice. Mice showing obvious tumors or that became moribund were euthanized and examined. (B) Radiograph showing a large malignant tumor in a 12-month-old lck-Cre-Mntflox/flox mouse. (C) Top parts, histopathologic analysis showing kidney and lung tumors (arrows). The normal lung morphology of lck-Cre-Mntflox/+ mice is shown in the inset. Lower parts, immunohistochemical analysis showing strong CD3 staining specifically in tumor tissue (arrows).

Similar articles

Cited by

References

    1. Adhikary, S., and M. Eilers. 2005. Transcriptional regulation and transformation by Myc proteins. Nat. Rev. Mol. Cell. Biol. 6:635-645. - PubMed
    1. Blyth, K., A. Terry, M. O'Hara, E. W. Baxter, M. Campbell, M. Stewart, L. A. Donehower, D. E. Onions, J. C. Neil, and E. R. Cameron. 1995. Synergy between a human c-myc transgene and p53 null genotype in murine thymic lymphomas: contrasting effects of homozygous and heterozygous p53 loss. Oncogene 10:1717-1723. - PubMed
    1. Broussard-Diehl, C., S. R. Bauer, and R. H. Scheuermann. 1996. A role for c-myc in the regulation of thymocyte differentiation and possibly positive selection. J. Immunol. 156:3141-3150. - PubMed
    1. Buckley, A. F., C. T. Kuo, and J. M. Leiden. 2001. Transcription factor LKLF is sufficient to program T cell quiescence via a c-myc-dependent pathway. Nat. Immunol. 2:698-704. - PubMed
    1. Cameron, E. R., M. Campbell, K. Blyth, S. A. Argyle, L. Keanie, J. C. Neil, and D. E. Onions. 1996. Apparent bypass of negative selection in CD8+ tumours in CD2-myc transgenic mice. Br. J. Cancer 73:13-17. - PMC - PubMed

Publication types

MeSH terms

Substances

LinkOut - more resources