. 2006 Mar;26(6):2373-86.
doi: 10.1128/MCB.26.6.2373-2386.2006.

Activation of transferrin receptor 1 by c-Myc enhances cellular proliferation and tumorigenesis

Affiliations

Activation of transferrin receptor 1 by c-Myc enhances cellular proliferation and tumorigenesis

Kathryn A O'Donnell et al. Mol Cell Biol. 2006 Mar.

Abstract

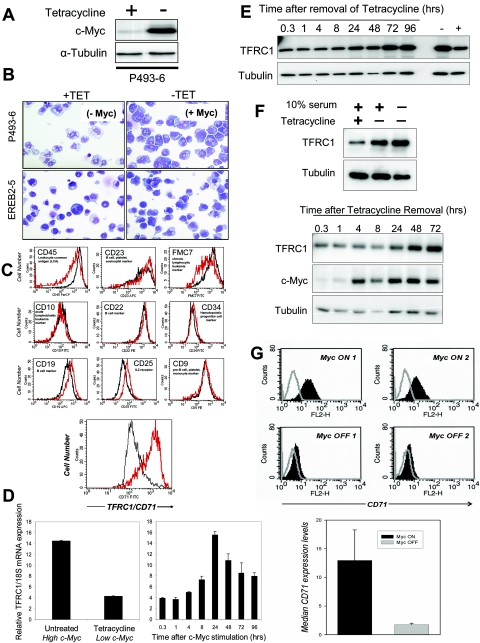
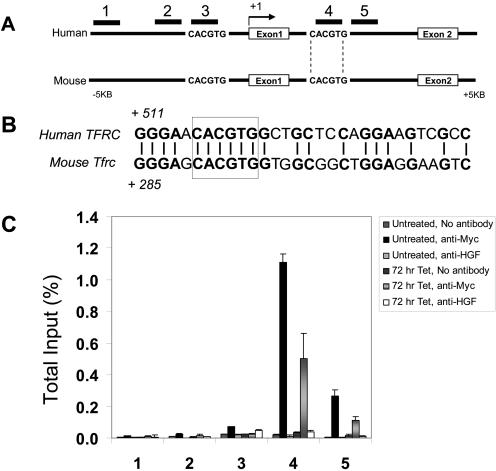
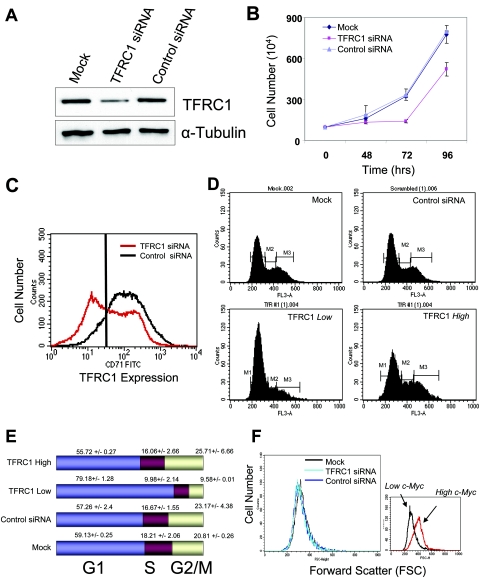
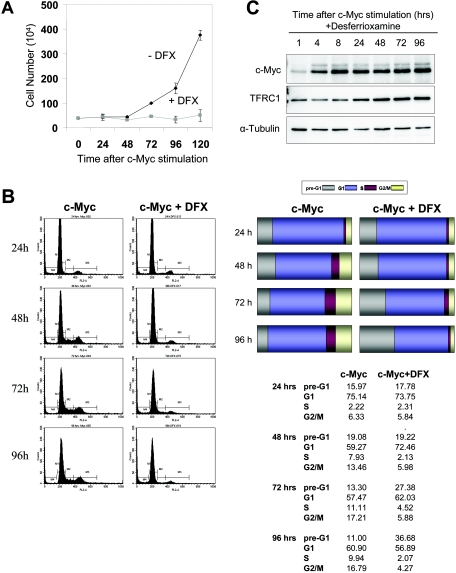
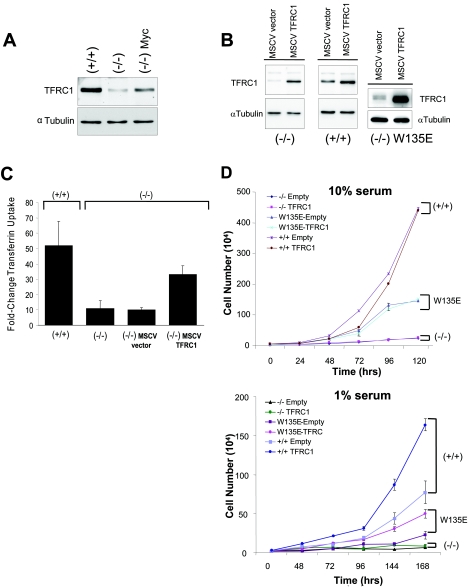
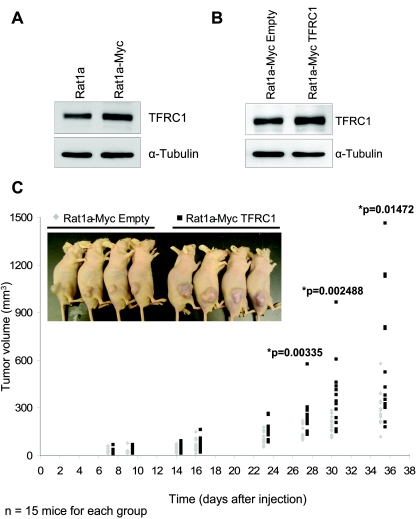
Overexpression of transferrin receptor 1 (TFRC1), a major mediator of iron uptake in mammalian cells, is a common feature of human malignancies. Therapeutic strategies designed to interfere with tumor iron metabolism have targeted TFRC1. The c-Myc oncogenic transcription factor stimulates proliferation and growth by activating thousands of target genes. Here we demonstrate that TFRC1 is a critical downstream target of c-Myc. Using in vitro and in vivo models of B-cell lymphoma, we show that TFRC1 expression is activated by c-Myc. Chromatin immunoprecipitation experiments reveal that c-Myc directly binds a conserved region of TFRC1. In light of these findings, we sought to determine whether TFRC1 is required for c-Myc-mediated cellular proliferation and cell size control. TFRC1 inhibition decreases cellular proliferation and results in G1 arrest without affecting cell size. Consistent with these findings, expression profiling reveals that TFRC1 depletion alters expression of genes that regulate the cell cycle. Furthermore, enforced TFRC1 expression confers a growth advantage to cells and significantly enhances the rate of c-Myc-mediated tumor formation in vivo. These findings provide a molecular basis for increased TFRC1 expression in human tumors, illuminate the role of TFRC1 in the c-Myc target gene network, and support strategies that target TFRC1 for cancer therapy.


Figures

FIG.1.
FIG.1.
TFRC1 Expression is responsive to c-Myc in B cells in vitro and in vivo. (A) Immunoblot analysis of c-Myc expression in P493-6. Cells were untreated or treated with 0.1 μg/ml tetracycline for 72 h. (B) Wright staining of P493-6 and EREB2-5 cells in the presence or absence of tetracycline. (C) FACS analysis of P493-6 cells using a panel of leukemia markers. Histograms represent expression of each cell surface marker in B cells with high c-Myc (red line; untreated) or low c-Myc (black line; Tet treated) expression levels. (D) Real-time PCR analysis of TFRC1 mRNA expression in untreated or Tet-treated P493-6 cells (left) and in P493-6 cells following induction of c-Myc by Tet removal (right). Bar graphs represent TFRC1 mRNA expression relative to 18S rRNA control. Error bars represent standard deviations derived from three independent measurements. (E) Immunoblot analysis of TFRC1 after Tet removal. α-Tubulin is used as a loading control. (F) Immunoblot analysis for TFRC1 and c-Myc expression in the absence of serum. P493-6 cells were treated with tetracycline for 72 h and then deprived of serum (0.1%) at the same time as tetracycline withdrawal to induce c-Myc expression. (G) Expression levels of transferrin receptor (CD71) on the surfaces of MycER-induced B-cell tumors. Top panel, flow cytometric analysis of CD71 expression. Cells were either left unstained (gray lines) or stained with the anti-CD71 antibody. Myc ON 1 and 2 refer to tumors from two different mice continuously treated with 4-OHT. Myc OFF 1 and 2 refer to tumors from two different mice initially treated with 4-OHT and then deprived of the hormone for 96 h. Bottom panel, quantitative analysis of CD71 expression. Median expression values plotted on the yaxis are differences between median fluorescence intensities of stained and unstained cells. Error bars represent standard deviations derived from two independent measurements in Myc ON and Myc OFF groups.
FIG. 2.
FIG. 2.
Chromatin immunoprecipitation validates TFRC1 as a direct c-Myc target gene. (A) Sequence alignment of the human and mouse transferrin receptor genomic locus (from 5 kb upstream of the transcriptional start site through intron 1) reveals two canonical E boxes. The E box flanked by vertical lines falls within a window of 65% nucleotide identity between human and mouse. PCR amplicons that were analyzed for c-Myc binding are indicated by numbers. (B) Alignment of the human and mouse sequences of the intron 1 E box (boxed). (C) Quantification of c-Myc binding by real-time PCR analysis (expressed as a percentage of total input DNA). ChIP was performed on untreated P493-6 cells or cells treated with Tet for 72 h using anti-Myc antibody or anti-hepatocyte growth factor as a control antibody. Error bars represent standard deviations derived from three independent measurements. A representative experiment is shown.
FIG. 3.
FIG. 3.
RNA interference of TFRC1 expression abrogates cell proliferation and cell cycle progression. (A) Immunoblot analysis of TFRC1 levels 72 h after transfection with siRNA oligonucleotides in unsorted cell populations. α-Tubulin is used as a loading control. (B) Growth rates are diminished after suppression of TFRC1. Cell proliferation was measured in mock-electroporated cells or in cells electroporated with TFRC1 or control siRNAs. Error bars represent standard deviations from two independent measurements. At least three independently performed experiments yielded similar results. (C) FACS analysis of anti-TFRC1-FITC labeled cells 72 h after transfection with siRNA oligonucleotides. (D) Cell cycle profiles after knockdown of TFRC1. Cells were double labeled with 7-amino-actinomycin and an anti-TFRC1-FITC antibody. (E) Bar graphs representing mean values and standard deviations of each cell cycle phase derived from three independent experiments. (F) Cell size remains unaffected after RNAi-mediated suppression of TFRC1. Forward light scattering (FSC) histograms obtained by FACS analysis are shown.
FIG. 4.
FIG. 4.
Iron depletion inhibits c-Myc-mediated cell proliferation and cell cycle progression. (A) Growth rates of P493-6 cells grown in the presence or absence of 100 μM DFX after tetracycline withdrawal. (B) Cell cycle profiles obtained by propidium iodide labeling of cells stimulated by c-Myc in the presence or absence of DFX. c-Myc stimulation results in cell cycle progression. In contrast, DFX-treated cells accumulate in G1 at early time points and subsequently undergo apoptosis at later time points. Bar graphs represent the percentage of cells in each phase of the cell cycle. Results of a representative experiment are shown. One independent experiment yielded similar results. (C) Immunoblot analysis of c-Myc and TFRC1 after DFX treatment. α-Tubulin is used as a loading control. Error bars for all panels represent standard deviations derived from at least two independent experiments.
FIG. 5.
FIG. 5.
Ectopic TFRC1 expression in Rat1 fibroblasts confers growth advantage in limiting (1%) serum conditions. (A) Immunoblot analysis of endogenous TFRC1 expression in c-MYC/ (HO15.19), c-MYC+/+ (TGR), and c-MYC/ cells reconstituted with human c-Myc (−/− Myc) Rat1 fibroblasts. α-Tubulin is used as a loading control. (B) Immunoblot analysis demonstrating TFRC1 overexpression in c-MYC null (HO15.19), wild-type (TGR), and W135E mutant cells infected with a human TFRC1 retrovirus. α-Tubulin is used as a loading control. (C) Transferrin uptake in +/+ (TGR) and −/− (HO15.19) cells and in −/− cells infected with an empty vector or a TFRC1 retrovirus. Quantitation was determined by FACS analysis after incubating cells with fluorescence-labeled transferrin for 30 min. Fold changes shown refer to median Tf uptake levels compared to those for unlabeled cells. The bar graph represents mean values and standard deviations derived from four independent experiments. (D) Growth rates under normal (10%) and limiting (1%) serum conditions. Error bars represent standard deviations derived from three independent measurements. The graph is representative of two independent experiments.
FIG. 6.
FIG. 6.
TFRC1 enhances tumorigenesis in Rat1a-Myc cells. (A) Western blot analysis of TFRC1 in Rat1a and Rat1a-Myc cells. α-Tubulin is used as a loading control. (B) Western blot analysis demonstrating TFRC1 overexpression in Rat1a-Myc cells. α-Tubulin is used as a loading control. (C) Analysis of tumor volume in nude mice. A two-tailed Student t test (type 3, unequal variance) was used to determine whether the difference between groups was statistically significant. A representative experiment is shown (n = 15 mice for each group). One independent tumorigenesis experiment yielded similar results.

References

    1. Adhikary, S., and M. Eilers. 2005. Transcriptional regulation and transformation by Myc proteins. Nat. Rev. Mol. Cell. Biol. 6:635-645. - PubMed
    1. Alizadeh, A. A., M. B. Eisen, R. E. Davis, C. Ma, I. S. Lossos, A. Rosenwald, J. C. Boldrick, H. Sabet, T. Tran, X. Yu, J. I. Powell, L. Yang, G. E. Marti, T. Moore, J. Hudson, Jr., L. Lu, D. B. Lewis, R. Tibshirani, G. Sherlock, W. C. Chan, T. C. Greiner, D. D. Weisenburger, J. O. Armitage, R. Warnke, R. Levy, W. Wilson, M. R. Grever, J. C. Byrd, D. Botstein, P. O. Brown, and L. M. Staudt. 2000. Distinct types of diffuse large B-cell lymphoma identified by gene expression profiling. Nature 403:503-511. - PubMed
    1. Becton, D. L., and P. Bryles. 1988. Deferoxamine inhibition of human neuroblastoma viability and proliferation. Cancer Res. 48:7189-7192. - PubMed
    1. Blatt, J., and S. Stitely. 1987. Antineuroblastoma activity of desferoxamine in human cell lines. Cancer Res. 47:1749-1750. - PubMed
    1. Bowen, H., T. E. Biggs, S. T. Baker, E. Phillips, V. H. Perry, D. A. Mann, and C. H. Barton. 2002. c-Myc represses the murine Nramp1 promoter. Biochem. Soc. Trans. 30:774-777. - PubMed

Publication types

MeSH terms

LinkOut - more resources