. 2006 Mar 1:7:100.
doi: 10.1186/1471-2105-7-100.

Methodological study of affine transformations of gene expression data with proposed robust non-parametric multi-dimensional normalization method

Affiliations

Methodological study of affine transformations of gene expression data with proposed robust non-parametric multi-dimensional normalization method

Henrik Bengtsson et al. BMC Bioinformatics. .

Abstract

Background: Low-level processing and normalization of microarray data are most important steps in microarray analysis, which have profound impact on downstream analysis. Multiple methods have been suggested to date, but it is not clear which is the best. It is therefore important to further study the different normalization methods in detail and the nature of microarray data in general.

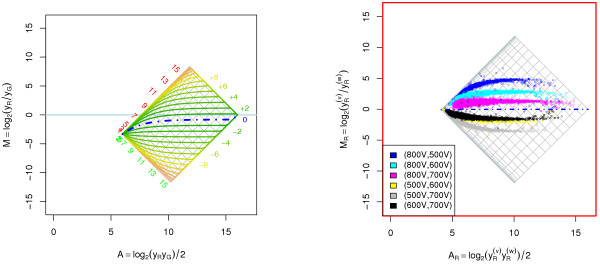
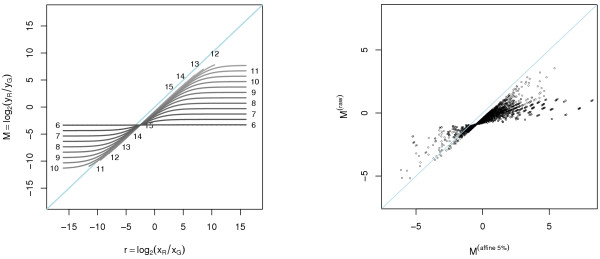
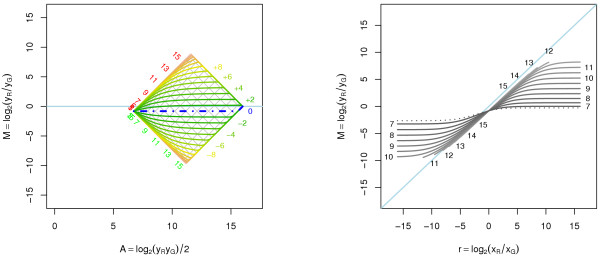
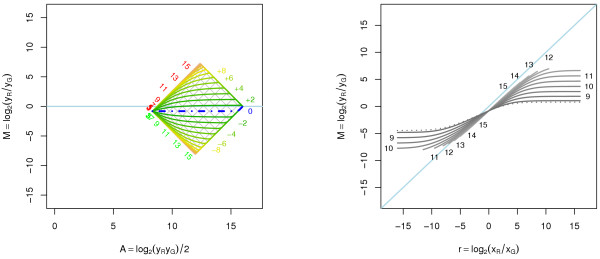
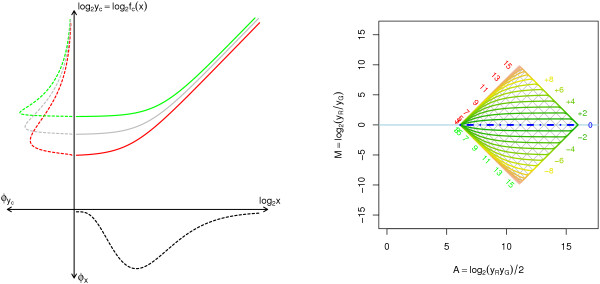
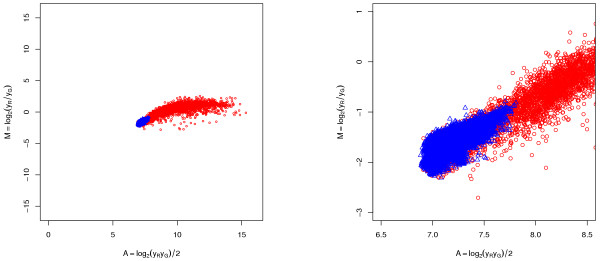
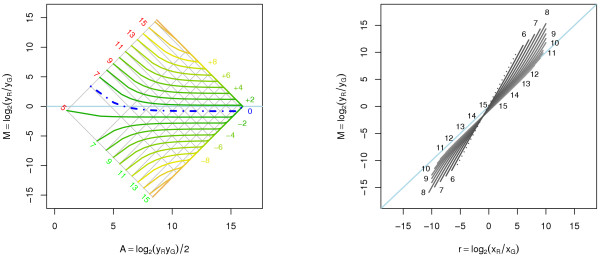
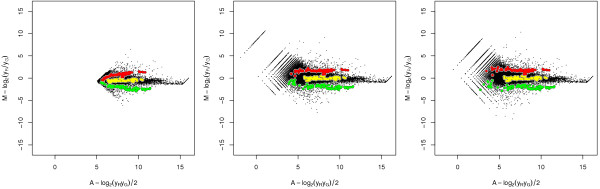
Results: A methodological study of affine models for gene expression data is carried out. Focus is on two-channel comparative studies, but the findings generalize also to single- and multi-channel data. The discussion applies to spotted as well as in-situ synthesized microarray data. Existing normalization methods such as curve-fit ("lowess") normalization, parallel and perpendicular translation normalization, and quantile normalization, but also dye-swap normalization are revisited in the light of the affine model and their strengths and weaknesses are investigated in this context. As a direct result from this study, we propose a robust non-parametric multi-dimensional affine normalization method, which can be applied to any number of microarrays with any number of channels either individually or all at once. A high-quality cDNA microarray data set with spike-in controls is used to demonstrate the power of the affine model and the proposed normalization method.

Conclusion: We find that an affine model can explain non-linear intensity-dependent systematic effects in observed log-ratios. Affine normalization removes such artifacts for non-differentially expressed genes and assures that symmetry between negative and positive log-ratios is obtained, which is fundamental when identifying differentially expressed genes. In addition, affine normalization makes the empirical distributions in different channels more equal, which is the purpose of quantile normalization, and may also explain why dye-swap normalization works or fails. All methods are made available in the aroma package, which is a platform-independent package for R.


Figures

Figure 1
Figure 1
Affine transformation of the red and the green signals. Left: Affine transformation of the red and the green signals for A1 = {(aG, aR) = (200, 20), (bG, bR) = (1.4, 0.8)}. The observed log-ratios as a function of the observed log-intensities for different fold changes. The blue dot-dash curve corresponds to the non-differentially expressed genes and the thinner curves above and below this curve represent log2r = ± 1, ± 2,... as labeled to the right of the curves. The lines in the gray grid, which is rotated 45 degrees (in (2A, M)), show the levels where the true signals log2 xR and log2 xG are equal to ..., -1, 0, 1,..., 16. These levels have been labeled to the left of the grid. No observations can lie outside this grid. Right: Real-world example of an affine transformation. The same slide was scanned four times at four different PMT settings. For each of the six scan pairs, the within-channel log-ratio and log-intensities were calculated. Data shown is from the red channel, which was estimated to have an offset of aR = 20.3 for all scans.
Figure 2
Figure 2
Bias in the log-ratios introduced by the affine transform. Left: Bias in the log-ratios introduced by the affine transform A1. Each line displays the relationship between the observed and the true log-ratios at a certain (observed) log-intensity A. Each curve is marked with the value of A. We have chosen to truncate the curves when the signals become saturated and the labels for those curves are positioned approximately where they have been truncated. For low intensities there is a great bias (deviance from the diagonal line), especially for large fold changes. At higher intensities the bias is smaller. The curves intersect at the one fold-change level that is independent of the intensity. Right: Real-world example of log-ratios for non-normalized versus affine normalized (with 5% negative) signals. The affine parameters are (a^G, a^R, log2β^) = (45.7, 27.0, -0.418). To clarify the intensity-dependent effect only data points close to A = 0.0, 0.5,...,16 are shown.
Figure 3
Figure 3
Curve-fit normalization of affine transformed data. Curve-fit normalization of A1 transformed data. Left: Log-ratios as a function of log-intensities for different fold changes. Note that the distance between up- and down-regulated genes at any intensity is the same before and after the normalization. Right: Normalized log-ratios versus true log-ratios. We see that intensity-dependent artifacts have been removed for the observed and true log-ratios where all curves intersect (here at (0, 0)).
Figure 4
Figure 4
Perpendicular translation normalization of affine transformed data. Perpendicular translation normalization of A1 transformed data. The optimal amount of normalization shift in the raw data is a = 60, which corresponds to aR = 80 and aG = 140. Left: Log-ratios as a function of log-intensities for certain fold changes. The r = 1 curve (dot-dash blue) is horizontal, that is, for this specific value of r and a the log-ratios are independent of the log-intensities. Right: Normalized log-ratios versus true log-ratios. From this graph it is clear that we obtain the minimum error in log-ratios at zero-fold change. The dotted curves correspond to the minimum and maximum log-intensities possible to observe.
Figure 5
Figure 5
Parallel translation normalization of affine transformed data. Parallel translation normalization of A1 transformed data. The optimal amount of normalization shift in the raw data is a = 220, which corresponds to an effective shift of (aG, aR) = (420, 240). Left: Log-ratios as a function of log-intensities for certain fold changes. The r = 1 curve (dot-dash blue) is horizontal, that is, for this specific value of r and a the log-ratios are independent of the log-intensities. Right: Normalized log-ratios versus true log-ratios. From this graph it is clear that we obtain the minimum error in log-ratios at zero-fold change.
Figure 6
Figure 6
Equalizing the signal densities of the two channels removes the intensity dependency of the log-ratios for non-differentially expressed genes. Equalizing the signal densities of the two channels remove the intensity dependency of the log-ratios of non-differentially expressed genes. Left: Equal gene-expression distributions in both channels will under the non-channel balanced affine transform A1 turn into two different densities for the measured data. The (upside-down and dashed) curve at the bottom shows a hypothetical density function, φx(·), of the true (log) gene-expression levels expected to be equal in both samples. The distributions of the affine transformed signals are shown in the (rotated and dashed) density functions, {φyc()}c, at the left (red and green curves). The average signal density (middle gray curve) to be normalized toward corresponds to a common measurement function (gray function in the main plot). Right: Normalizing the non-equal densities of the two channels makes the log-ratios of the non-differentially expressed genes zero for all intensities.
Figure 7
Figure 7
Transformation of background signal. Transformation of background signal. Left: An M versus A scatter plot where background signals (blue triangles) and foreground signals (red circles) lye along the same curve, which is evidence that both have been transformed identically. Right: A zoom-in of the left graph. Data is from [50].
Figure 8
Figure 8
Affine transformation with negative translation. Affine transformation of the red and the green signals with negative translation where (aG, aR) = (-87, -24), (bG,bR) = (1.4,0.8). Left: Log-ratios as a function of log-intensities for certain fold changes. Right: Translated log-ratios versus true log-ratios. The slope of a line fitted in the M versus M plot will be larger than one, which is due to the negative translation. The grid and the fold-change curves in the left graph, and the intensity curves in the right graph have been truncated such that xR,xG ≥ 1.
Figure 9
Figure 9
Log-ratios versus log-intensities before and after a robust affine normalization. Log-ratios versus log-intensities before and after a robust affine normalization. Left: Non-normalized data. Spike-ins designed to have log2r = +2, 0, and -2 are highlighted in red, yellow and green, respectively. Middle: Affine normalization utilizing constraint (32) resulting in no negative signals. Parameter estimates used in back transformation are (a^G, a^R, log2β^) = (39.0, 22.0, -0.418). Right: Affine normalization where 5% (default) negative signals has been allowed; Parameter estimates used in back transformation are (a^G, a^R, log2β^) = (45.7, 27.0, -0.418). The rotated binning effects of data points at low intensities are due to (unnecessary) rounding of average spot pixel intensity to nearest integer by the image analysis software.

Similar articles

Cited by

References

    1. Schena M, Shalon D, Davis RW, Brown PO. Quantitative monitoring of gene expression patterns with a complementary DNA microarray. Science. 1995;270(5235):467–470. - PubMed
    1. Duggan DJ, Bittner M, Chen Y, Meltzer P, Trent JM. Expression profiling using cDNA microarrays. Nature Genetics. 1999;21(1 Supplement):10–14. doi: 10.1038/4434. - DOI - PubMed
    1. Rocke DM, Durbin B. A Model for Measurement Error for Gene Expression Arrays. Journal of Computational Biology. 2001;8(6):557–569. doi: 10.1089/106652701753307485. - DOI - PubMed
    1. Yang YH, Dudoit S, Luu P, Lin DM, Peng V, Ngai J, Speed TP. Normalization for cDNA microarray data: a robust composite method addressing single and multiple slide systematic variation. Nucelic Acids Research. 2002;30(4):e15. doi: 10.1093/nar/30.4.e15. - DOI - PMC - PubMed
    1. Bengtsson H. Identification and normalization of plate effects in cDNA microarray data. Preprints in Mathematical Sciences 2002:28, Mathematical Statistics, Centre for Mathematical Sciences, Lund University, Sweden; 2002.

Publication types