. 2006 May;17(5):2424-38.
doi: 10.1091/mbc.e05-10-0938. Epub 2006 Mar 1.

Motion matters: secretory granule motion adjacent to the plasma membrane and exocytosis

Affiliations

Motion matters: secretory granule motion adjacent to the plasma membrane and exocytosis

Miriam W Allersma et al. Mol Biol Cell. 2006 May.

Abstract

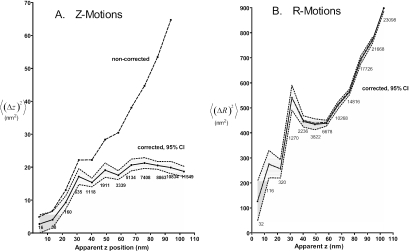
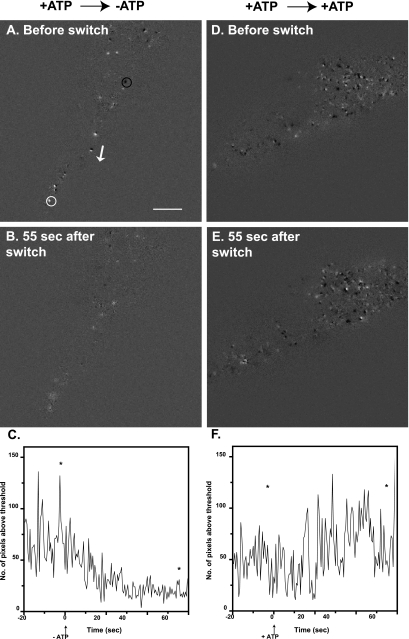
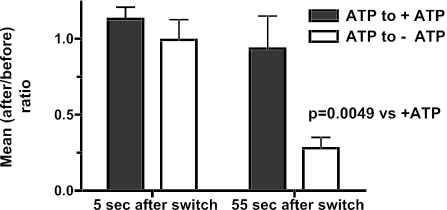
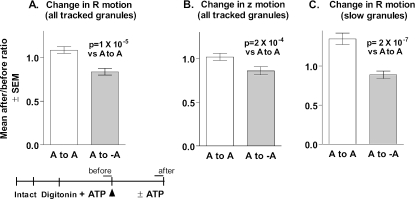
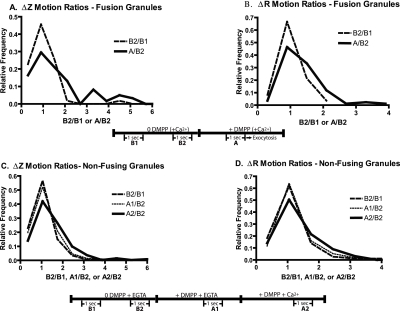
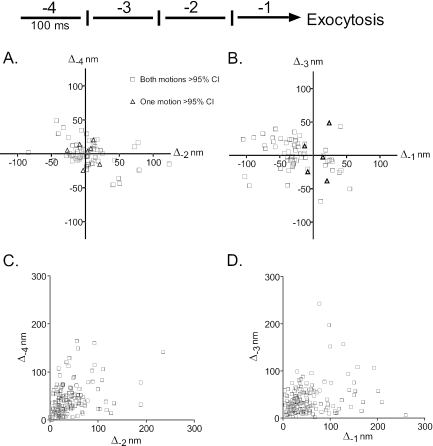
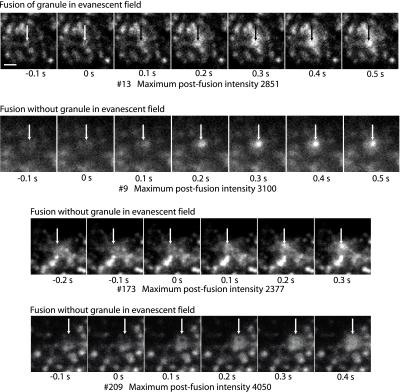
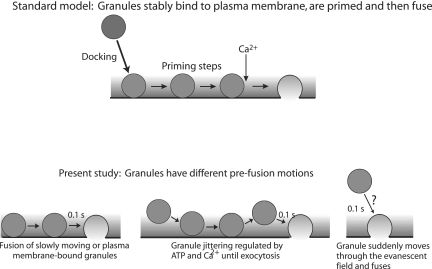
Total internal reflection fluorescence microscopy was used to monitor changes in individual granule motions related to the secretory response in chromaffin cells. Because the motions of granules are very small (tens of nanometers), instrumental noise in the quantitation of granule motion was taken into account. ATP and Ca2+, both of which prime secretion before fusion, also affect granule motion. Removal of ATP in permeabilized cells causes average granule motion to decrease. Nicotinic stimulation causes a calcium-dependent increase in average granule motion. This effect is more pronounced for granules that undergo exocytosis than for those that do not. Fusion is not preceded by a reduction in mobility. Granules sometimes move 100 nm or more up to and within a tenth of a second before fusion. Thus, the jittering motion of granules adjacent to the plasma membrane is regulated by factors that regulate secretion and may play a role in secretion. Motion continues until shortly before fusion, suggesting that interaction of granule and plasma membrane proteins is transient. Disruption of actin dynamics did not significantly alter granule motion.


Figures

Figure 1.
Figure 1.
<(Δz)2> and <(ΔR)2> versus z corrected for noise. The apparent z position is based on the observed average intensity between successive pairs of z or R measurements, with the corresponding Δz or ΔR placed in the appropriate uniformly spaced z bin. The brightest granule in the cell is used to define z = 0. Uncorrected values are straight averages of the (Δz)2 or (ΔR)2 in each bin. The corrected values take into account that part of the uncorrected values that arise from instrumental noise, as described in the Appendix. The gray band around the corrected values represent the ±2 × SE (i.e., 95% confidence) values, as calculated according to the Appendix. The uncorrected and corrected average R motions almost overlap. With the correction and the uncertainty band, one can see that the real motion both for Δz or ΔR is significant at all apparent z positions, it increases with z, and it is generally larger for R (the lateral direction) than for z (orthogonal to the substrate and presumably the membrane).
Figure 2.
Figure 2.
Difference-image analysis of granule movement before and after removal of ATP. Chromaffin cells were labeled with transiently expressed ANP-GFP, which targets to the secretory granule. Cells were visualized by TIRFM and followed for 20 s before being permeabilized for 30 s with 20 μM digitonin in NaGEP buffer containing 2 mM MgATP, incubated for an additional 60 s in the continuing presence of MgATP, and finally incubated for 60 s in the absence (A-C) or presence (D-F) of MgATP. These movies were subjected to difference-image analysis. Each image was subtracted from the subsequent image on a pixel by pixel basis. A dark spot indicates a negative change (i.e., the disappearance of a granule), an example of which is circled in black in A. A bright white spot (white circle in A) indicates a positive change. A black/white pair (adjacent to white arrow, A) indicates a granule moving laterally, in the direction of black to white (direction indicated by white arrow). (C and F) For each difference-image, the number of pixels above a threshold (or below a negative threshold) was counted. Threshold values were large enough to exclude pixel differences that were in the background, but not so large as to exclude all pixels in the light or dark spots. Asterisks in C and F mark the location of the individual difference-images shown in A and B and D and E, respectively. Bar, 5 μm.
Figure 3.
Figure 3.
Summary of difference-image analysis. The number of pixels above a threshold (or below a negative threshold) was counted and averaged over three eight-frame intervals: 4 s before the removal of ATP, 4 s immediately after the switch to -ATP, and eight frames taken 55 s after the switch. For each cell, (after/before) ratios were calculated comparing the mean number of pixels greater than the threshold after the switch (either 5 or 55 s) to the mean number of pixels greater than the threshold before the switch. Thus each cell served as its own control. Student's t test was performed on the logarithms of the ratios (n = 6 cells/group). The logarithms were used (rather than the ratios themselves) since the ratio is an intrinsically asymmetrical measure and the logarithmic transformation is approximately Gaussian.
Figure 4.
Figure 4.
Tracking granule motions before and after removal of ATP. The movements of individual granules in the cells from Figure 3 were tracked for twenty frames (2 Hz) before and after the removal of MgATP, and ratios [mean motion after/mean motion before] were calculated for each tracked granule. (A) Change in lateral (R) motion for all tracked granules. ATP to ATP, n = 177; ATP to no ATP, n = 114. (B) Change in z motion for all tracked granules. (C) Change in R motion for granules with mean ΔRbefore < 10 nm. ATP to ATP, n = 72; ATP to no ATP, n = 69.
Figure 5.
Figure 5.
Nicotininc stimulation causes Ca2+-dependent increases in granule motion. Chromaffin cells were transiently transfected with a plasmid encoding VAMP-GFP, which labels secretory granules. (A and B) Cells were visualized with TIRFM for 5 s before stimulation with the nicotinic agonist DMPP in the presence of 2.2 mM Ca2+. The noise-corrected z and R motions of individual granules that underwent secretion were determined during two 1-s intervals (10 Hz, frame acquisition) before stimulation (B1 and B2) and then during a 1-s interval 1.2-0.2 s before exocytosis. Ratios of the mean motions immediately before exocytosis to that before stimulation (A/B2) were calculated for each granule. Changes in motion unrelated to stimulation, B2/B1 ratios, were also determined. Motions of 59 granules in z and 84 granules in R from 19 cells were calculated. The numbers were limited to granules that could be tracked from the beginning of the experiment with motions at least twice the estimated noise. The distributions of the ratio of motions are significantly different for A/B2 versus B1/B2 for Δz and ΔR (p < 0.003 and 0.0001, respectively, Mann-Whitney U test). (C and D) Effects of nicotinic stimulation on granules not undergoing exocytosis were investigated. Cells were bathed in Ca2+-free PSS with 0.1 mM EGTA and sequentially perfused with Ca2+-free PSS with 2 mM EGTA (including intervals B1 and B2), 20 μM DMPP without Ca2+ + 2 mM EGTA (including interval A1), and finally with 20 μM DMPP + 10 mM Ca2+ (including interval A2). Noise-corrected Δz and ΔR motions of greater than 330 individually tracked granules from 13 cells were determined. Mean motions during each of the 1-s intervals were determined and the indicated ratios were calculated. p < 0.001 for the distributions of both Δz and ΔR ratios of A2/B2 versus B2/B1 (Mann-Whitney U test).
Figure 6.
Figure 6.
The last four granule motions before fusion. The motions of 159 granules before fusion were determined. (A and B) The z motions are shown during intervals -4 and -2, and during intervals -3 and -1, respectively, before exocytosis. Motions toward the glass interface are negative. Motions are shown for which one or both of the pair has or have greater than a 95% probability of not being accounted for by instrumental noise (see Appendix). Both measurements were at greater than 95% confidence intervals for 63 and 62 granules in A and B, respectively. (C and D) The R motions are shown during intervals -4 and -2, and during intervals -3 and -1, respectively, before exocytosis. All R motions were statistically significant at the 95% confidence interval.
Figure 7.
Figure 7.
Fusion can occur without the granule occurring in the evanescent field. Three events are shown (9, 173, and 209) in which fusion occurs with the granule not evident in the evanescent field within 100 ms of the event. For comparison, event 13 (top sequence) shows a granule in the evanescent field immediately before fusion. Images were taken at 10 Hz. Zero time is the frame just before the fusion event that is characterized by spreading and increase in the intensity. The arrows indicate the position of the fusion event and are identically placed in the frames within a sequence. The maximum postfusion intensity (in arbitrary units; a.u.) reflects the total amount of VAMP-GFP in the granule after it is exposed to the extracellular medium at pH 7.4. The median postfusion fluorescence of granules that were present in the evanescent field before fusion was 2000 a.u. Note that event 9 shows a hint of an out-of-focus granule at -0.1 and 0 s. The out-of-focus granule is probably visualized because of a small amount of contaminating propagated light caused by spurious reflections in the objective lens (Mattheyses and Axelrod, 2006) and/or interaction of the evanescent field with highly refractive intracellular structures (Oheim and Stuhmer, 2000). Bar, 1 μm.
Figure 8.
Figure 8.
Behavior of granules before exocytosis. A standard model for exocytosis is that granules translocate from the cell interior to the plasma membrane and stably bind or dock to the plasma membrane. After subsequent priming steps, the granule is able to fuse with the plasma membrane in respond to elevated Ca2+. The present study indicates that granules that undergo exocytosis can have numerous behaviors immediately preceding fusion. Some granules do not undergo detectable motion and may be bound to the plasma membrane. Others are jittering in place within 100 ms of fusion. A few granules are not present in the evanescent field before fusion and may move through it within 100 ms of fusion. Granule and plasma membrane priming events can occur before the final docking step that leads to fusion.

References

    1. Allersma, M. W., Wang, L., Axelrod, D., and Holz, R. W. (2004). Visualization of regulated exocytosis with a granule-membrane probe using total internal reflection microscopy. Mol. Biol. Cell 15, 4658-4668. - PMC - PubMed
    1. Axelrod, D. (1981). Cell-substrate contacts illuminated by total internal reflection fluorescence. J. Cell Biol. 89, 141-145. - PMC - PubMed
    1. Axelrod, D. (2001). Selective imaging of surface fluorescence with very high aperture microscope objectives. J. Biomed. Opt. 6, 6-13. - PubMed
    1. Axelrod, D. (2003). Total internal reflection fluorescence microscopy in cell biology. Methods Enzymol. 361, 1-33. - PubMed
    1. Axelrod, D., Burghardt, T. P., and Thompson, N. L. (1984). Total internal reflection fluorescence. Annu. Rev. Biophys. Bioeng. 13, 247-268. - PubMed

Publication types

LinkOut - more resources