. 2006 Mar 15;20(6):648-53.
doi: 10.1101/gad.1384706. Epub 2006 Mar 1.

Identification of phosphatases for Smad in the BMP/DPP pathway

Affiliations

Identification of phosphatases for Smad in the BMP/DPP pathway

Hong B Chen et al. Genes Dev. .

Abstract

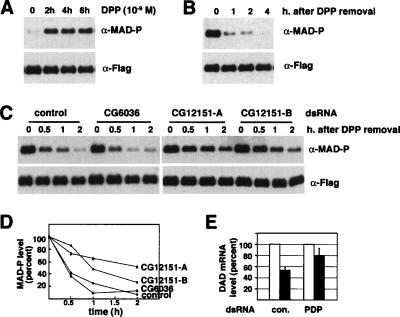
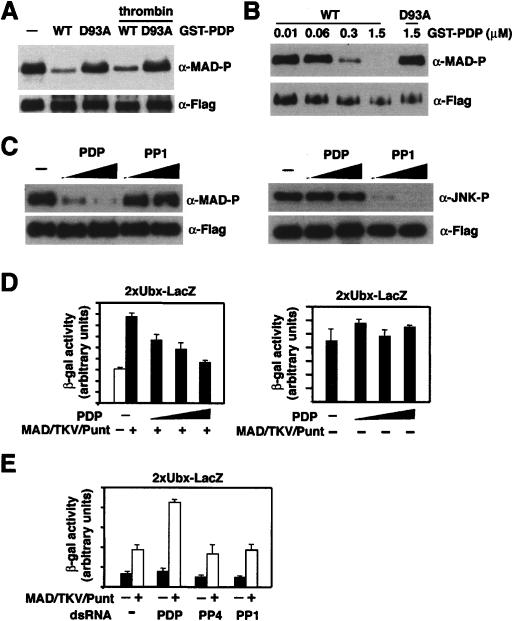
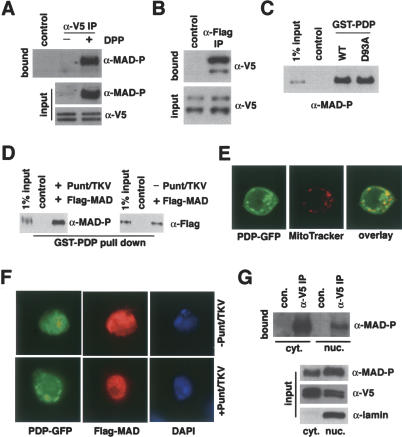
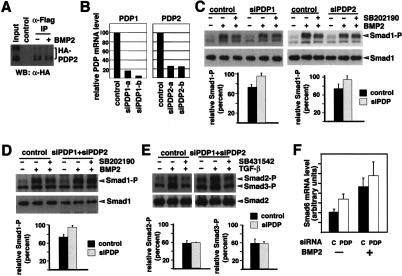
Phosphorylation of the SSXS motif of Smads is critical in activating the transforming growth factor beta (TGF-beta) and bone morphogenetic protein (BMP) pathways. However, the phosphatase(s) involved in dephosphorylating and hence inactivating Smads remained elusive. Through RNA interference (RNAi)-based screening of serine/threonine phosphatases in Drosophila S2 cells, we identified pyruvate dehydrogenase phosphatase (PDP) to be required for dephosphorylation of Mothers against Decapentaplegic (MAD), a Drosophila Smad. Biochemical and genetic evidence suggest that PDP directly dephosphorylates MAD and inhibits signal transduction of Decapentaplegic (DPP). We show that the mammalian PDPs are important in dephosphorylation of BMP-activated Smad1 but not TGF-beta-activated Smad2 or Smad3. Thus, PDPs specifically inactivate Smads in the BMP/DPP pathway.


Figures

Figure 1.
Figure 1.
Identification of PDP as a phosphatase required for dephosphorylation of MAD. (A) Continuous presence of DPP resulted in persistent phosphorylation of MAD for up to 6 h. Flag-MAD was inducibly expressed in S2 cells followed by DPP treatment. C-terminally phosphorylated MAD (having the same SSXS and adjacent residues as Smad1) was detected by anti-phospho-Smad1 (α-MAD-P). (B) The same S2 cells as in A were first stimulated by DPP for 2 h and washed by PBS to remove DPP, and continued to be cultured in regular media. At indicated time points, phospho-MAD and total Flag-MAD were detected by the indicated antibodies. (C) The same S2 cell line was treated with the indicated dsRNAs for 72 h before being analyzed as in B. (D) Quantitation of phospho-MAD signal in C. The signal of phospho-MAD was quantitated using NIH Image, normalized to that of total Flag-MAD, and plotted. The phospho-MAD level at the 0 time point was arbitrarily set as 100%. (E) The DAD mRNA level was measured by quantitative real-time PCR at the peak DPP-induced level (10−9 M for 2 h) (white bars) and 2 h after DPP removal (black bars). The peak level was arbitrarily set as 100%. The mRNA level of the ribosomal protein rp49 was used as the quantitation standard. The presented values are based on four independent experiments.
Figure 2.
Figure 2.
Genetic aberrations of pdp lead to ectopic accumulation of phospho-MAD in Drosophila embryos. (A) Immunostaining of Drosophila embryos using the PS1 antisera. Side views of the wild-type (WT), Df(1)ct4b1 (Df), and PBacCG12151 (PBac) embryos at indicated developmental stages. Note the punctate PS1 staining in mutant embryos. As a control, no punctate pattern was observed for Toll. (B,C) PS1 staining of wild-type (B) and PBacCG12151 (C) stage 6 embryos (side views). The magnified boxed areas are shown on the right. The arrowheads point to phospho-MAD in the nuclei of dorsal midline cells, and the arrows point to the ectopic punctate staining of phospho-MAD observed only in the mutant. (D) PS1 staining of stage 6 wild-type (bottom) and PBacCG12151 embryos from the dorsal view. The magnified boxed area is shown on the top right. The arrowheads and arrows are as described in C. (E) Phospho-MAD staining of PBacCG12151 embryos at stage 2. Magnified versions of the boxed area are shown in the bottom panels, including the overlay of PS1 (green) and DAPI (blue) staining. The arrowheads mark the chromosomes, and the arrows point to phospho-MAD.
Figure 3.
Figure 3.
PDP directly dephosphorylates MAD and inhibits DPP-responsive reporter expression. (A) In vitro phosphatase assay. Purified GST-PDP or the D93A mutant was used as the enzyme, with or without GST removal by thrombin as indicated. Flag-MAD expressed in DPP (10−9 M)-treated S2 cells was immunoprecipitated and used as the substrate. Phospho-MAD and total Flag-MAD were detected by anti-phospho-Smad1 and anti-Flag immunoblotting, respectively. (B) Phosphatase assay as in A using different concentrations of GST-PDP. (C) In vitro phosphatase assay using phospho-MAD (left) or phospho-JNK1 (right) as the substrate. As indicated, recombinant GST-PDP (0.3 μM, 1.5 μM) or PP1 (2 U, 10 U) was used. Phospho- and total Flag-JNK1 were detected by anti-phospho-JNK1 and anti-Flag immunoblotting, respectively. (D, left) MAD-activated 2xUbx-lacZ expression in S2R+ cells was repressed by PDP in a dose-dependent manner. (Right) The same PDP overexpression did not affect the basal reporter expression in the absence of activated MAD. A Tk-luc reporter was cotransfected as an internal control, and the presented value of β-gal activity has been normalized to the luciferase activity. (E) S2R+ cells treated with indicated dsRNAs (PP4: CG11597; PP1: CG8822) were subjected to reporter assay as in D.
Figure 4.
Figure 4.
PDP interaction with MAD and its subcellular localization. (A) Coimmunoprecipitation of endogenous phospho-MAD and PDP-V5. S2 cells were induced to express PDP-V5 followed by DPP (10−9 M) treatment. The whole-cell extract was immunoprecipitated by anti-V5, and the bound proteins were analyzed by anti-phospho-Smad1. Protein A + G beads alone were used as the control. Expression of PDP-V5 and endogenous phospho-MAD was detected by indicated antibodies (input). (B) S2 cells expressing Flag-MAD and PDP-V5 were stimulated by DPP (10−9 M), and the whole-cell extract was subject to immunoprecipitation with anti-Flag. The bound and input proteins were immunoblotted with anti-V5. (C) S2 cells coexpressing Flag-MAD, Punt, and TKV were used to prepare cell extract containing phospho-MAD and used in GST pull-down using wild-type GST-PDP or the D93A mutant. Bound proteins were analyzed by anti-phospho-Smad1 immunoblotting. GST beads alone were used as the control. (D) GST-pull-down experiments comparing PDP interaction with phosphorylated or unphosphorylated MAD. Extracts from S2 cells expressing Flag-MAD with or without Punt and TKV were used as the source of phospho- or unphosphorylated MAD, respectively. (E) Live S2 cells expressing PDP-GFP were stained with MitoTracker Deep Red 633, and the fluorescent images were captured by confocal microscopy. (F) S2 cells expressing PDP-GFP and Flag-MAD were stained with anti-Flag and analyzed by fluorescent microscopy. Punt and TKV were coexpressed as indicated to induce nuclear accumulation of Flag-MAD. (G) Coimmunoprecipitation of PDP and phospho-MAD in cytosol and nucleus. S2 cells transfected with PDP-V5 and Flag-MAD were stimulated with DPP before nuclear and cytosolic fractions were prepared for immunoprecipitation with anti-V5. The bound proteins were analyzed by anti-phospho-Smad1. Lamin was detected exclusively in the nuclear fraction, validating the subcellular fractionation procedure.
Figure 5.
Figure 5.
Knockdown of PDP1 and PDP2 affect dephosphorylation of Smad1 in mammalian cells. (A) 293T cells expressing Flag-Smad1 and HA-PDP2 were treated with BMP2 as indicated before whole-cell extract was prepared for anti-Flag immunoprecipitation. The bound proteins were analyzed by anti-HA. (B) HeLa cells were transfected with indicated siRNA duplexes, and the mRNA levels of PDP1 and PDP2 were measured 72 h later by quantitative real-time RT–PCR. (C) siRNAs against PDPs inhibited dephosphorylation of Smad1. HeLa cells transfected with control, siPDP1 (siPDP1-a and 1-b), or siPDP2 (siPDP2-a and 2-b) siRNA duplexes were analyzed for dephosphorylation of Smad1 as described in Materials and Methods. (Bottom) The reduction in phospho-Smad1 level after SB202190 treatment was quantitated as the percentage of the phospho-Smad1 level before SB202190 treatment. NIH Image was used to quantitate immunoblot signals from three separate experiments, and the plotted values have been normalized to the total Smad1 level. (D,E) HeLa cells transfected with control or combined siPDP1-a and siPDP2-a siRNA duplexes were analyzed for dephosphorylation of Smad1 (D) and Smad2/3 (E). The quantitation was done as in C, with the level of total Smad1 (D) or Smad2 (E) serving as the normalization standard. (F) Combined siRNA against PDPs (PDP), but not the control siRNA (C), enhanced expression of Smad6 in HeLa cells. Quantitative real-time PCR was used to measure Smad6 mRNA level before and after BMP2 treatment (100 ng/mL, 2 h), using 18s rRNA as the quantitation standard. The plotted values are based on three independent experiments.

Similar articles

Cited by

References

    1. Abdollah S., Macias-Silva M., Tsukazaki T., Hayashi H., Attisano L., Wrana J.L. TβRI phosphorylation of Smad2 on Ser465 and Ser467 is required for Smad2–Smad4 complex formation and signaling. J. Biol. Chem. 1997;272:27678–27685. - PubMed
    1. Attisano L., Wrana J.L. Signal transduction by the TGF-β superfamily. Science. 2002;296:1646–1647. - PubMed
    1. Barford D., Das A.K., Egloff M.P. The structure and mechanism of protein phosphatases: Insights into catalysis and regulation. Annu. Rev. Biophys. Biomol. Struct. 1998;27:133–164. - PubMed
    1. Chen X., Rubock M.J., Whitman M. A transcriptional partner of MAD proteins in TGF-β signalling. Nature. 1996;383:691–696. - PubMed
    1. Clemens J.C., Worby C.A., Simonson-Leff N., Muda M., Maehama T., Hemmings B.A., Dixon J.E. Use of double-stranded RNA interference in Drosophila cell lines to dissect signal transduction pathways. Proc. Natl. Acad. Sci. 2000;97:6499–6503. - PMC - PubMed

Publication types