Comparative Study
. 2006 Mar;16(3):428-35.
doi: 10.1101/gr.4526006.

Systematic identification of functional orthologs based on protein network comparison

Affiliations
Comparative Study

Systematic identification of functional orthologs based on protein network comparison

Sourav Bandyopadhyay et al. Genome Res. 2006 Mar.

Abstract

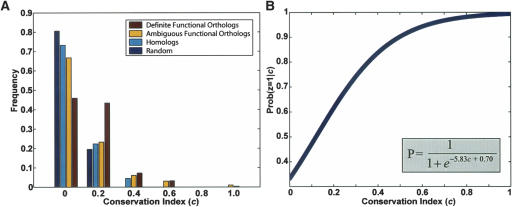
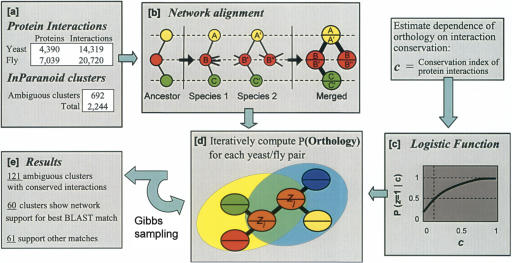
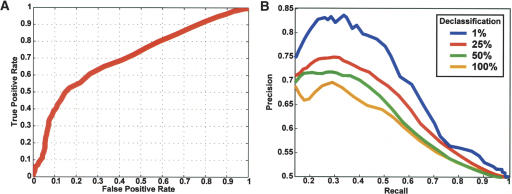
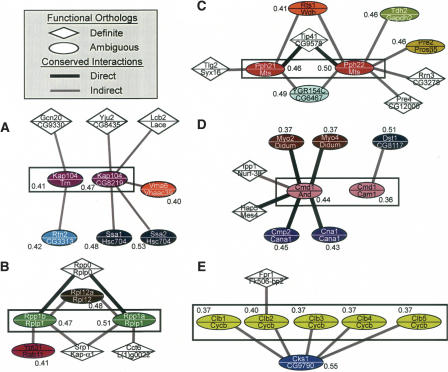
Annotating protein function across species is an important task that is often complicated by the presence of large paralogous gene families. Here, we report a novel strategy for identifying functionally related proteins that supplements sequence-based comparisons with information on conserved protein-protein interactions. First, the protein interaction networks of two species are aligned by assigning proteins to sequence homology clusters using the Inparanoid algorithm. Next, probabilistic inference is performed on the aligned networks to identify pairs of proteins, one from each species, that are likely to retain the same function based on conservation of their interacting partners. Applying this method to Drosophila melanogaster and Saccharomyces cerevisiae, we analyze 121 cases for which functional orthology assignment is ambiguous when sequence similarity is used alone. In 61 of these cases, the network supports a different protein pair than that favored by sequence comparisons. These results suggest that network analysis can be used to provide a key source of information for refining sequence-based homology searches.


Figures

Figure 1.
Figure 1.
(A) Network neighborhood conservation for definite orthologs vs. other yeast/fly protein pairs. The distribution of the conservation index “c” is shown for definite functional orthologs (sole members of an Inparanoid cluster), ambiguous functional orthologs (in a cluster with multiple members), homologs (different clusters but similar sequences), and random protein pairs. Definite functional orthologs show a shift toward higher conservation of protein interactions between the yeast and fly protein networks. Mean c = 0.1512, 0.1171, 0.0870, 0.0615 for definite functional orthologs, ambiguous functional orthologs, homologs, and random pairs, respectively. (B) Logistic function relating conservation index to probability of functional orthology. Logistic regression was performed by using the “definite functional ortholog” and “homolog” pairs as positive vs. negative training data, respectively. The resulting function is shown.
Figure 2.
Figure 2.
Overview of the method. (a) Protein–protein interaction networks for yeast and fly are combined with clusters of orthologous yeast and fly protein sequences as determined by the Inparanoid algorithm. (b) Networks are aligned into a merged graph representation. In this example, a gene duplication results in two proteins B′ and B″ in species 2 that are orthologous to protein B in species 1. One of these proteins may experience a gain and/or loss of interactions to enable new functional roles (Wagner 2003); however, only conserved interactions are represented in the alignment graph. (c) The logistic function shown in Figure 1B is used to compute the probability of functional orthology for a protein pair given the states of functional orthology for its network neighbors. (d) This probability is updated for each pair over successive iterations of Gibbs sampling. (e) The final probabilities confirm 60 of the best BLAST match pairings. The network supports a different hypothesis for 61 pairings.
Figure 3.
Figure 3.
(A) Estimated accuracy of the method. The Receiver Operating Characteristic (ROC) curve shows the true-positive rate (percentage of true data predicted correctly as positive) vs. the false-positive rate (percentage of false data predicted incorrectly, i.e., positive) of the method. (B) Dependence of predictions on number of available training examples. Percentage precision (percentage of positive predictions that were correct) vs. recall (true-positive rate) is plotted as the probability cutoff ranges from [0–1]. Different color plots correspond to different percents of declassification of training examples.
Figure 4.
Figure 4.
Example orthologs resolved by network conservation. Each node represents a putative functional match between a yeast/fly protein pair (with names shown above/below the line, respectively). Links between nodes denote conserved interactions (thick black, direct interactions in both species; thin gray, indirect interaction in one of the species; see Methods). Diamond- vs. oval-shaped nodes represent definite vs. ambiguous functional orthologs. Oval nodes of the same color represent ambiguous protein pairs belonging to the same Inparanoid cluster. The mean probability of functional orthology is given next to each ambiguous pair. Cluster 246 (A), 1439 (B), 211 (C), 917 (D), and 1104 (E) show examples of clusters that were disambiguated by conserved network information; the cluster resolved in each panel is outlined by a black rectangle.

References

    1. Aebersold, R. and Mann, M. 2003. Mass spectrometry-based proteomics. Nature 422: 198–207. - PubMed
    1. Aitchison, J.D., Blobel, G., and Rout, M.P. 1996. Kap104p: A karyopherin involved in the nuclear transport of messenger RNA binding proteins. Science 274: 624–627. - PubMed
    1. Altschul, S.F., Madden, T.L., Schaffer, A.A., Zhang, J., Zhang, Z., Miller, W., and Lipman, D.J. 1997. Gapped BLAST and PSI-BLAST: A new generation of protein database search programs. Nucleic Acids Res. 25: 3389–3402. - PMC - PubMed
    1. Besag, J. 1974. Spatial interaction and the statistical analysis of lattice systems. J. Roy. Statist. Soc. B: 192–236.
    1. Brenner, S.E. 1999. Errors in genome annotation. Trends Genet. 15: 132–133. - PubMed

Publication types

MeSH terms