. 2006 Mar;3(1):1-8.
doi: 10.1088/1741-2560/3/1/001. Epub 2005 Dec 19.

Role of electrode design on the volume of tissue activated during deep brain stimulation

Affiliations

Role of electrode design on the volume of tissue activated during deep brain stimulation

Christopher R Butson et al. J Neural Eng. 2006 Mar.

Abstract

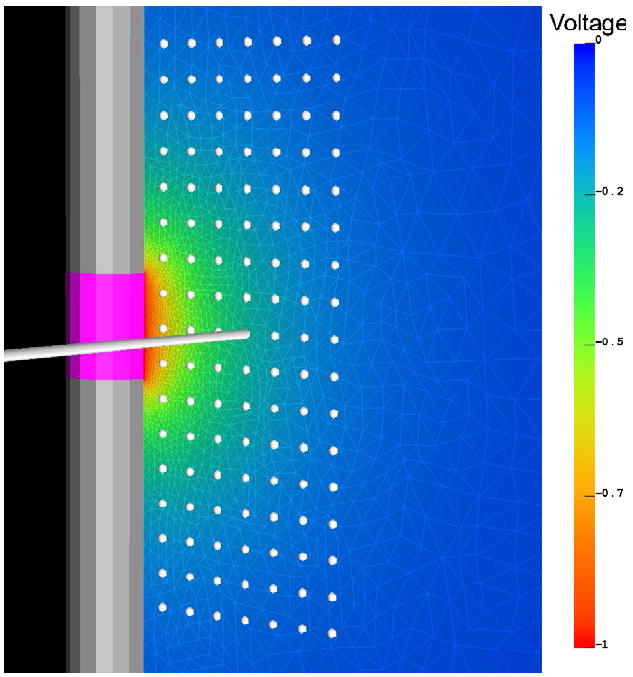
Deep brain stimulation (DBS) is an established clinical treatment for a range of neurological disorders. Depending on the disease state of the patient, different anatomical structures such as the ventral intermediate nucleus of the thalamus (VIM), the subthalamic nucleus or the globus pallidus are targeted for stimulation. However, the same electrode design is currently used in nearly all DBS applications, even though substantial morphological and anatomical differences exist between the various target nuclei. The fundamental goal of this study was to develop a theoretical understanding of the impact of changes in the DBS electrode contact geometry on the volume of tissue activated (VTA) during stimulation. Finite element models of the electrodes and surrounding medium were coupled to cable models of myelinated axons to predict the VTA as a function of stimulation parameter settings and electrode design. Clinical DBS electrodes have cylindrical contacts 1.27 mm in diameter (d) and 1.5 mm in height (h). Our results show that changes in contact height and diameter can substantially modulate the size and shape of the VTA, even when contact surface area is preserved. Electrode designs with a low aspect ratio (d/h) maximize the VTA by providing greater spread of the stimulation parallel to the electrode shaft without sacrificing lateral spread. The results of this study provide the foundation necessary to customize electrode design and VTA shape for specific anatomical targets, and an example is presented for the VIM. A range of opportunities exist to engineer DBS systems to maximize stimulation of the target area while minimizing stimulation of non-target areas. Therefore, it may be possible to improve therapeutic benefit and minimize side effects from DBS with the design of target-specific electrodes.


Figures

Figure 1
Figure 1
Field-axon model. Axisymmetric FEM (wireframe) of the electrode (shaft: gray, contact: pink) and surrounding medium (σ = 0.3 S m−1) with voltage solution according to colorbar at right. The 17 × 7 array of axons was oriented perpendicular to the electrode shaft as shown for a single representative fiber (white spheres indicate positions of other axons). The voltage solution was interpolated onto the cable model axons for calculation of the stimulus voltage thresholds and Δ2Vex2 threshold values.
Figure 2
Figure 2
Δ2Vex2 as a predictor of neural activation. (A) Δ2Vex2 threshold values are shown for the Medtronic electrode as a function of distance measured from the center of the electrode for 60 μs, 90 μs and 210 μs pulse width. An exponential curve fit (solid line shown for 90 μs, y = 36.38 ex/.97 + 6.89) can provide accurate prediction of activating function thresholds for individual pulse widths and electrode designs. (B) However, the predictor curve used in part (A) does not extend well to multiple electrode designs. Here, raw data are shown for all electrode designs used in figure 3(A) for 90 μs pulse width; the accuracy of the curve fit (y = 29.88 ex/1.14 + 6.80) is limited by the increased variability of threshold values. (C) A more general predictor that is applicable to the range of electrode designs and pulse widths expresses the activating function as a function of cathodic voltage (V) * pulse width (PW, μs) (curve fit: y = 22.70 ex/50.90 + 4.30). Raw data are shown for the three electrode designs from figure 3(A) for 60 μs, 90 μs and 210 μs pulse width stimulation. (D) Ellipsoid-based predictors (black lines) can provide a spatial map of activation for a variety of electrode designs and stimulation parameters. In this example, the ellipse predictors for voltage-controlled stimulation are overlaid on filled Δ2Vex2 threshold contours (color bar at right) generated from the integrated field-axon model for 90 μs pulse width.
Figure 3
Figure 3
Effects of electrode geometry on VTA for constant surface area electrodes. (A) Filled contour plots show Δ2Vex2 threshold values corresponding to the colorbar at right. Each plot shows the VTA at four voltage values (−0.4 V, −0.6 V, −0.8 V, and −1.0 V) for 130 Hz stimulation. Plots are organized by pulse width (rows) and electrode design (columns). (B) Electrode diameter and height are correlated with VTA aspect ratio. Data are shown for all pulse widths at a stimulus amplitude of −1 V. (C) VTA volume increases linearly with electrode height. The slope of each line is modulated by pulse width. (D) VTA volume decreases in a roughly logarithmic fashion with increasing diameter, modulated by pulse width.
Figure 4
Figure 4
Thalamic VIM stimulation with different electrode designs. (A) 3D view of thalamus with DBS electrode and T1 MRI projected onto background slices. (B) VIM within thalamus with a DBS electrode. (C) The Medtronic electrode, with stimulation settings of −1 V and 90 μs pulse width, produces a VTA that fills 26% of the VIM before spilling over into adjacent nuclei. (D) The VIM is better stimulated using an electrode with 0.75 mm diameter and 2.54 mm height, producing a VTA that fills 33% of the volume without spillover.

References

    1. Benabid AL, Pollak P, Gao D, Hoffmann D, Limousin P, Gay E, Payen I, Benazzouz A. Chronic electrical stimulation of the ventralis intermedius nucleus of the thalamus as a treatment of movement disorders. J Neurosurg. 1996;84:203–14. - PubMed
    1. Butson CR, Hall J, Henderson JM, McIntyre CC. Patient-specific models of deep brain stimulation: 3D visualization of anatomy, electrode and volume of activation as a function of the stimulation parameters. Soc Neurosci Abstr 1011.11 2004
    1. Butson CR, Maks CB, Cooper SE, Henderson JM, McIntyre CC. Deep brain stimulation interactive visualization system. Soc Neurosci Abstr 898.7 2005b
    1. Butson CR, Maks CB, McIntyre CC. Sources and effects of electrode impedance during deep brain stimulation. Clin Neurophysiol. 2005a at press. - PMC - PubMed
    1. Butson CR, McIntyre CC. Tissue and electrode capacitance reduce neural activation volumes during deep brain stimulation. Clin Neurophysiol. 2005;116:2490–500. - PMC - PubMed

Publication types