. 2006 Mar;116(3):783-96.
doi: 10.1172/JCI26582.

A regulatory role for the C5a anaphylatoxin in type 2 immunity in asthma

Affiliations

A regulatory role for the C5a anaphylatoxin in type 2 immunity in asthma

Jörg Köhl et al. J Clin Invest. 2006 Mar.

Abstract

Complement component 5 (C5) has been described as either promoting or protecting against airway hyperresponsiveness (AHR) in experimental allergic asthma, suggesting pleomorphic effects of C5. Here we report that local pharmacological targeting of the C5a receptor (C5aR) prior to initial allergen sensitization in murine models of inhalation tolerance or allergic asthma resulted in either induction or marked enhancement of Th2-polarized immune responses, airway inflammation, and AHR. Importantly, C5aR-deficient mice exhibited a similar, increased allergic phenotype. Pulmonary allergen exposure in C5aR-targeted mice resulted in increased sensitization and accumulation of CD4+ CD69+ T cells associated with a marked increase in pulmonary myeloid, but not plasmacytoid, DC numbers. Pulmonary DCs from C5aR-targeted mice produced large amounts of CC chemokine ligand 17 (CCL17) and CCL22 ex vivo, suggesting a negative impact of C5aR signaling on pulmonary homing of Th2 cells. In contrast, C5aR targeting in sensitized mice led to suppressed airway inflammation and AHR but was still associated with enhanced production of Th2 effector cytokines. These data suggest a dual role for C5a in allergic asthma, i.e., protection from the development of maladaptive type 2 immune responses during allergen sensitization at the DC/T cell interface but enhancement of airway inflammation and AHR in an established inflammatory environment.


Figures

Figure 1
Figure 1
Protocols underlying the different models of pulmonary allergy. (A) OVA model of inhalation tolerance. Animals were exposed to i.t. OVA at the indicated time points. To block C5aR signaling, animals were treated with anti-C5aR mAb on days –1 and 20. Twenty-four hours after the final allergen exposure, airway responsiveness was determined. Subsequently, BAL, lung tissue, and blood samples were taken. (B) HDM model of pulmonary allergy in which the C5aR was blocked during initial allergen exposure. Animals were exposed to i.t. HDM at the indicated time points (left panel). To block C5aR signaling, animals were treated with the anti-C5aR mAb on days –1, 6, 13, and 20. Seventy-two hours after the final HDM exposure, airway responsiveness was determined. Subsequently BAL, lung tissue, and blood samples were taken. For right panel, procedure was as above, except that the C5aR was blocked by pulmonary expression of the C5aRA. C5aRA expression was initiated 7 days prior to allergen exposure by supplementing the drinking water with dox (0.5 mg/ml). Dox was kept in the drinking water throughout the experiment. (C) Procedure was as in B, except that the C5aR was blocked solely prior to the final HDM exposure on day 20.
Figure 2
Figure 2
C5aR targeting induces Th2 adaptive immune responses and eosinophilic airway inflammation in response to pulmonary OVA exposure. (A) Cytokine profile of pulmonary cells harvested from BALB/c mice 24 hours after final OVA exposure. Supernatants were collected after 72 hours in vitro culture. (B) Serum concentration of total IgE. (C) Total and differential cell counts in BAL. (D) Histological examination of airway inflammation. Sections were stained for mucus production with PAS (left panels) and with H&E (right panels). Original magnification, ×200. (E) Airway responsiveness to i.v. acetylcholine (Ach). Airway responsiveness is expressed as the time-integrated change in airway pressure over baseline pressure (APTI). In all figures, values shown are the mean ± SEM; n = 8–10 per group. **P < 0.001; *P < 0.05.
Figure 3
Figure 3
C5aR targeting enhances Th2 adaptive immune responses and eosinophilic airway inflammation in response to pulmonary HDM exposure. (A) Cytokine profile of pulmonary cells harvested from BALB/c mice 72 hours after the final in vivo HDM exposure. (B) Serum concentrations of total IgE and allergen-specific IgG1. (C) Histological examination of airway inflammation. Sections were stained for mucus production with PAS (left panels) and with H&E (right panels). (D) Airway responsiveness to i.v. Ach. n = 8–10 per group. **P < 0.001; *P < 0.05.
Figure 4
Figure 4
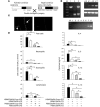
Generation and characterization of C5aRA Tg mice. (A) Generation of C5aR Tg mice (see Methods). rCCSP, rat clara cell–specific promoter; hGHpA, human growth hormone polyadenylation signal; bGHpA, bovine growth hormone polyadenylation signal. (B, upper left panel) Ccsp-rtTa sTg mice (545 bp, lane 1) were bred to (tetO)7-CMV-C5aRA sTg mice (228 bp, lane 2) to generate C5aRA-Cssp dTg progeny (C5aRA-Ccsp dTg, lane 3). M, marker (200–900 bp). (Upper right panel) Kinetic of induction of pulmonary C5aRA mRNA in C5aRA-Ccsp dTg mice. RT-PCR was performed from whole-lung samples of C5aRA-Ccsp dTg mice that received drinking water without dox (day 0) or dox-supplemented water (0.5 mg/ml) for 1 day, 3 days, or 7 days. Control reactions with GAPDH primers are shown in the lower panel. (Lower panel) Organ specificity of Tg activation in C5aRA-Ccsp dTg mice treated with dox for 7 days. Lane 1, lung from C5aRA sTg mouse; lanes 2–7, liver, spleen, kidney, heart, brain, and lung from C5aRA-Ccsp dTg mouse; lane 8, genomic DNA from C5aRA-Ccsp dTg (positive control). (C) C5aRA protein expression in lung epithelial cells (indicated by arrows) from C5aRA-Ccsp dTg mice treated for 7 days with dox. Immunohistochemical staining using anti-C5a mAb 561: Alexa488 (left panel); ISO-Ctrl (right panel). We found no C5aRA protein expression in lung epithelial cells of C5aRA sTg mice treated with dox (data not shown). (D, left panel) Total and differential cell counts in BAL. (Right panel) Cytokine profile of pulmonary cells harvested from BALB/c mice 72 hours after final in vivo HDM exposure. Cytokine profiles and BAL cell counts obtained from HDM-exposed non-Tg littermates were indistinguishable from those of HDM-exposed C5aRA sTg mice (data not shown). *P < 0.05; **P < 0.001.
Figure 5
Figure 5
Flow cytometric and functional characterization of pulmonary DC populations. (A, middle left panel) Dot plot of pulmonary cells isolated from naive BALB/c mice and double stained for the expression of CD11c (x axis) and 7-amino-actinomycin D (7AAD; y axis). (Upper middle panel) Dot plot of 7AAD and CD11c+ cells that were double stained for Gr-1 (x axis) and CD11b surface expression (y axis). (Lower left panel) Dot plot of CD11c+CD11b gated cells that were stained for mPDCA-1/B220 expression; percentages in boxed regions indicate the frequency of CD11c+ cells that were mPDCA-1+B220 and mPDCA-1+B220+, respectively. (Lower middle panel) Dot plot of CD11c+CD11b gated cells that were stained for mPDCA-1/Gr-1 expression. Percentages in boxed regions indicate the frequency of CD11c+ cells that are mPDCA-1+Gr-1 and mPDCA-1+Gr-1+ respectively. (Upper left panel) C5aR expression on mDCs (CD11c+, CD11b+, and Gr-1 cells). (Upper right panel) C5aR expression on CD11c+, CD11b+, and Gr-1+ cells. (Lower right panel) C5aR expression on pDCs (CD11c+, CD11b, and Gr-1+ cells). Black histogram profiles, specific staining with anti-C5aR mAb 20/70: Alexa488. White histogram profiles, ISO-Ctrl.). (B) IL-10 and IL-13 productions from cocultures of FACS-sorted CD11c+ DCs and CD4+ lymphocytes. (C, left panels) Ability of FACS-sorted mDCs and pDCs to induce production of Th2 cytokines from sorted CD4+ lymphocytes. (Right panels) Ability of pDCs to suppress mDC-induced production of Th2 cytokines from CD4+ lymphocytes. n = 8–10 per group. **P < 0.001; *P < 0.05.
Figure 6
Figure 6
Impact of C5aR targeting on pulmonary DC subset composition. Numbers of mDCs and pDCs (A and B, left panels) harvested from lungs of HDM-exposed BALB/c mice 16 hours after the final (A) or primary (B) in vivo exposure. Calculated mDC/pDC ratios are also shown (right panels). n = 8–10 per group. **P < 0.001; *P < 0.05.
Figure 7
Figure 7
C5a suppresses recruitment of Th2 effector cells through negative regulation of CCL17 and CCL22. (A) Increased numbers of activated Th2 effector cells in response to C5aR blockade. Lymphocytes were isolated from lung tissue 16 hours after the final HDM exposure in the presence or absence of C5aR blockade. Cells were stained for expression of CD4 and CD69 surface markers. (B) CCL17 and CCL22 production from cocultures of FACS-sorted CD11c+ DCs and CD4+ T cells. (C) Same as B, except that chemokine production is from cocultures of CD11c+ DCs and CD4+ T cells that were FACS-sorted 16 hours following the first HDM exposure. n = 8–10 per group. **P < 0.001; *P < 0.05.
Figure 8
Figure 8
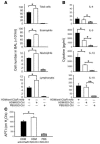
Opposing proallergic and antiallergic effects of C5a during the effector phase of pulmonary allergy. C5aR was blocked 1 day prior to the final HDM exposure by i.t. administration of a neutralizing anti-C5aR mAb. All experiments were performed 72 hours after the final in vivo HDM exposure. (A) Total and differential cell counts in BAL. (B) Cytokine profiles of pulmonary cells. (C) Airway responsiveness to i.v. Ach. n = 8–10 per group. **P < 0.001; *P < 0.05.
Figure 9
Figure 9
Effects of C5a and C5adesArg on ASM contraction and airway inflammation. (A) ASM contraction of tracheal rings stimulated with Ach, C5a, or C5adesArg. Shown is the maximal absolute isometric force evoked by the indicated agents. (B) Bronchoconstriction in response to i.t. administration of C5a/C5adesArg to naive mice (left panel) and to mice repeatedly exposed to HDM (right panel), respectively. (C) Total and differential cell counts in response to i.t. instillation of C5a/C5adesArg to mice repeatedly (×4) exposed to HDM. n = 6–10 per group. * P < 0.05.

Comment in

References

    1. Wills-Karp M. Immunologic basis of antigen-induced airway hyperresponsiveness. Annu. Rev. Immunol. 1999;17:255–281. - PubMed
    1. Wills-Karp M, Ewart SL. Time to draw breath: asthma-susceptibility genes are identified. Nat. Rev. Genet. 2004;5:376–387. - PubMed
    1. Maruo K, Akaike T, Ono T, Okamoto T, Maeda H. Generation of anaphylatoxins through proteolytic processing of C3 and C5 by house dust mite protease. J. Allergy Clin. Immunol. 1997;100:253–260. - PubMed
    1. Huber-Lang M, et al. Generation of C5a by phagocytic cells. Am. J. Pathol. 2002;161:1849–1859. - PMC - PubMed
    1. Köhl J. Anaphylatoxins and infectious and non-infectious inflammatory diseases. Mol. Immunol. 2001;38:175–187. - PubMed

Publication types

MeSH terms