Comparative Study
. 2006 Apr 1;572(Pt 1):67-85.
doi: 10.1113/jphysiol.2006.106872. Epub 2006 Mar 2.

Effect of 30 per cent maternal nutrient restriction from 0.16 to 0.5 gestation on fetal baboon kidney gene expression

Affiliations
Comparative Study

Effect of 30 per cent maternal nutrient restriction from 0.16 to 0.5 gestation on fetal baboon kidney gene expression

L A Cox et al. J Physiol. .

Abstract

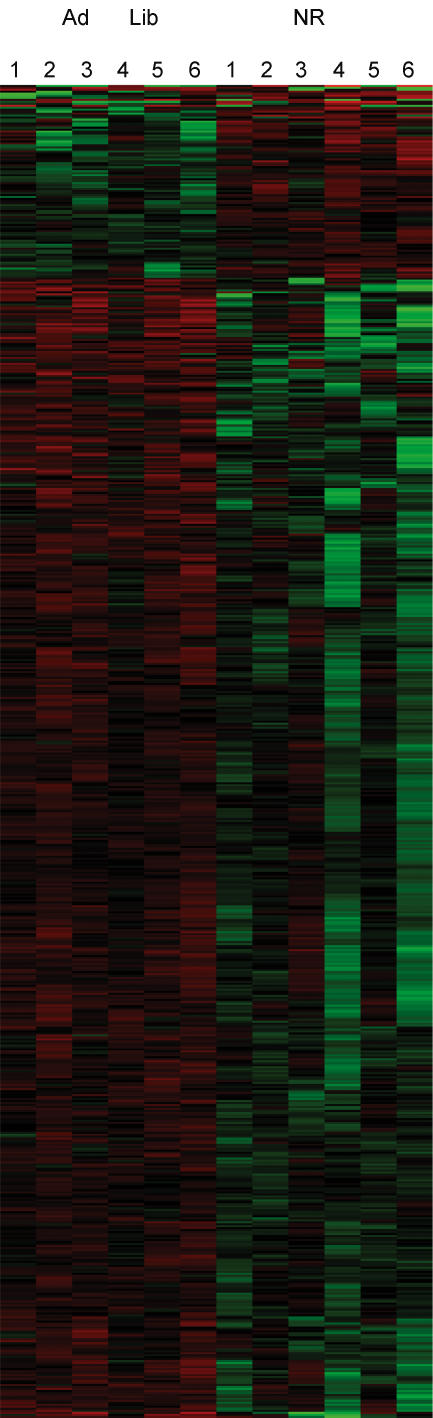
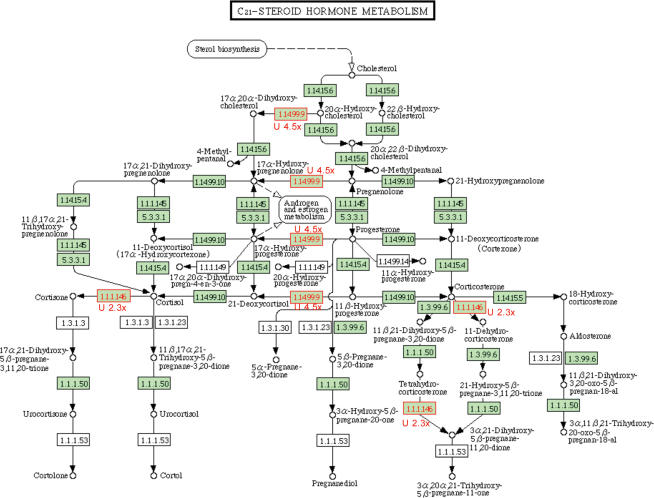
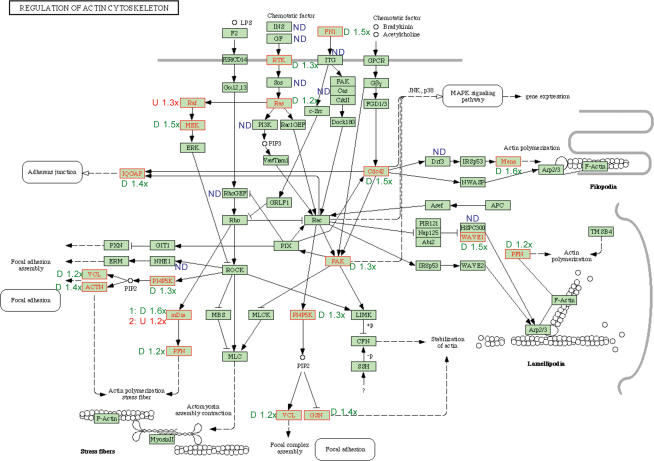
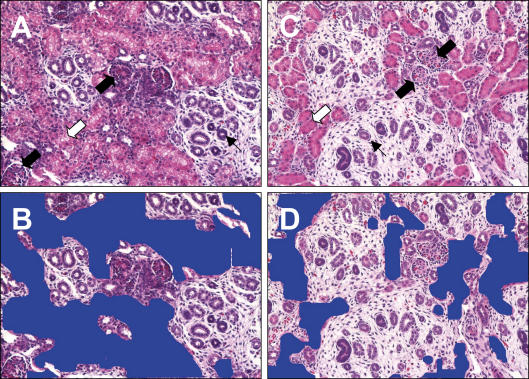
Previous studies in rodents and sheep show that maternal nutrient restriction during pregnancy alters fetal renal development. To date, no studies using fetal baboon RNA with human Affymetrix gene chips have been published. In the present study we have (1) evaluated the specificity of the Affymetrix human gene array 'Laboratory on a Chip' system for use with fetal baboon mRNA and (2) investigated the effects of moderate maternal global nutrient restriction (NR; 70% of ad libitum animals) from early (30 days gestation (dG)) to mid-gestation (90 dG; term = 184 dG) on the fetal baboon kidney. Morphometric and blood measurements were made on 12 non-pregnant baboons before they were bred. All baboons were fed ad libitum until 30 days pregnant, at which time six control baboons continued to feed ad libitum (control - C) while six received 70% of the C diet on a weight adjusted basis. Fetal kidneys were collected following caesarean section at 90 dG, with samples flash frozen and fixed for histological assessment. Fetal hip circumference was decreased in the NR group (68 +/- 2 versus 75 +/- 2 mm), while fetal body weight and all other measurements of fetal size were not different between C and NR at 90 dG. Maternal body weight was decreased in the NR group (12.16 +/- 0.34 versus 13.73 +/- 0.55 kg). Having established the specificity of the Affymetrix system for fetal baboon mRNA, gene expression profiling of fetal kidneys in the context of our maternal nutrient restriction protocol shows that NR resulted in a down-regulation of genes in pathways related to RNA, DNA and protein biosynthesis, metabolism and catabolism. In contrast, genes in cell signal transduction, communication and transport pathways were up-regulated in the NR group. These changes indicate that even a moderate level of maternal global NR impacts fetal renal gene pathways. Our histological assessment of renal structure indicates decreased tubule density within the cortex of NR kidneys compared with controls. The number of glomerular cross-sections per unit area were unaffected by NR, suggesting that tubule tortuosity and/or tubule length was decreased in the NR kidney. Taken together the changes indicate that NR results in accelerated fetal renal differentiation. The negative impact of poor maternal nutrition on the fetal kidney may therefore be in part due to shortening of critical phases of renal growth resulting in decreased functional capacity in later life. These findings may have important implications for postnatal renal function, thereby contributing to the observed increased predisposition to hypertension and renal disease in the offspring of nutrient restricted mothers.


Figures

Figure 1
Figure 1. Heat Map of 685 significantly differently expressed genes comparing RNA samples from kidneys of 90 dG fetuses from control (n = 6) and nutrient restricted mothers (n = 6)
Control fetuses are represented in the 6 left columns (Ad Lib) and samples from fetuses of nutrient restricted mothers are represented in the 6 right columns (NR). Increased expression of experimental versus control samples is indicated in red and decreased expression of experimental versus control is represented in green.
Figure 2
Figure 2. Differential expression of genes encoding factors in the C21-steroid hormone metabolism pathway
Both significantly differentially expressed genes in the C21-steroid hormone metabolism pathway are up-regulated. Homo sapiens specific genes in the pathway are indicated by black font in green boxes. Differentially expressed genes are indicated by red font in a green box. The fold change in expression is indicated numerically with the direction of change indicated by ‘U’ for up-regulated genes. 1.1.1.146 (EC number) denotes HSD11B (gene ID), hydroxysteroid (11-β) dehydrogenase and 1 and 1.14.99.9 denotes CYP17A1, cytochrome P450, family 17, subfamily A, polypeptide 1.
Figure 3
Figure 3. Differential expression of genes encoding actin cytoskeleton assembly
Fourteen of 16 differentially expressed genes are down-regulated. One gene ‘mDia’ has one family member up-regulated (DIAPH1) and one family member up-regulated (DIAPH2). Homo sapiens specific genes in the pathway are indicated by black font in green boxes. Genes that showed expression on the array are indicated by black font in blue boxes. Differentially expressed genes are indicated by red font in a green box. The fold change in expression is indicated numerically with the direction of change indicated by ‘D’ for down-regulated genes, ‘U’ for up-regulated genes, and ‘ND’ for genes where no signal was detected. Gene names, gene identifications in parentheses, and KEGG gene abbreviations for differentially expressed genes in this pathway are: actinin, α1 (ACTN1), ACTN; cell division cycle 42 (CDC42), CDC42; diaphanous homologue 1 (DIAPH1), mDia; diaphanous homologue 1 (DIAPH1), Mena; early lymphoid activating protein (DIAPH2), mDia; fibronectin 1 (FN1), FN1; gelsolin (GSN), GSN; IQ motif containing GTPase activating protein 1 (IQGAP1), IQGAP; mitogen-activated protein kinase kinase 1 (MAP2K1), MEK; P21(CDKN1A)-activated kinase 4 (PAK4), PAK; phosphatidylinositol-4-phosphate 5-kinase I gamma (PIP5K1C), PI4P5K; platelet-derived growth factor receptor, α polypeptide (PDGFRA), RTK; profilin 2 (PFN2), PFN; vinculin (VCL), VCL; V-Ki-ras2 Kirsten rat sarcoma viral oncogene (KRAS2), RAS; V-raf murine sarcoma viral oncogene homologue B1 (BRAF), RAF; WAS protein family, member 1 (WASF1), WAVE1.
Figure 4
Figure 4. Histological analysis of 90 dG C and NR kidney sections
Representative photomicrographs (20× magnification) of 5 μm kidney sections from ad libitum fed controls (A) and 30% nutrient restricted (C) baboon fetuses at 90 days of gestation. The area occupied by tubules is represented in blue in the same photomicrographs in control (B) and nutrient restricted (D) animals.

References

    1. Abramoff M, Magelhaes P, Ram S. Image processing with ImageJ. Biophotonics Int. 2004;11:36–42.
    1. Antonow-Schlorke I, Schwab M, Li C, Nathanielsz PW. Glucocorticoid exposure at the dose used clinically alters cytoskeletal proteins and presynaptic terminals in the fetal baboon brain. J Physiol. 2003;547:117–123. - PMC - PubMed
    1. Ashburner M, Ball CA, Blake JA, Botstein D, Butler H, Cherry JM, et al. Gene ontology: tool for the unification of biology. The Gene Ontology Consortium. Nat Genet. 2000;25:25–29. - PMC - PubMed
    1. Belloni AS, Albertin G, Forneris ML, Nussdorfer GG. Proadrenomedullin-derived peptides as autocrine-paracrine regulators of cell growth. Histol Histopathol. 2001;16:1263–1274. - PubMed
    1. De Vos K. Department of Biological Sciences, Columbia University. 2006. http://rsb.info.nih.gov/ij/plugins/cell-counter.html.

Publication types

MeSH terms