. 2006 May 1;572(Pt 3):691-706.
doi: 10.1113/jphysiol.2005.102368.

Characterization of voltage-dependent sodium and calcium channels in mouse pancreatic A- and B-cells

Affiliations

Characterization of voltage-dependent sodium and calcium channels in mouse pancreatic A- and B-cells

Sheila Vignali et al. J Physiol. .

Abstract

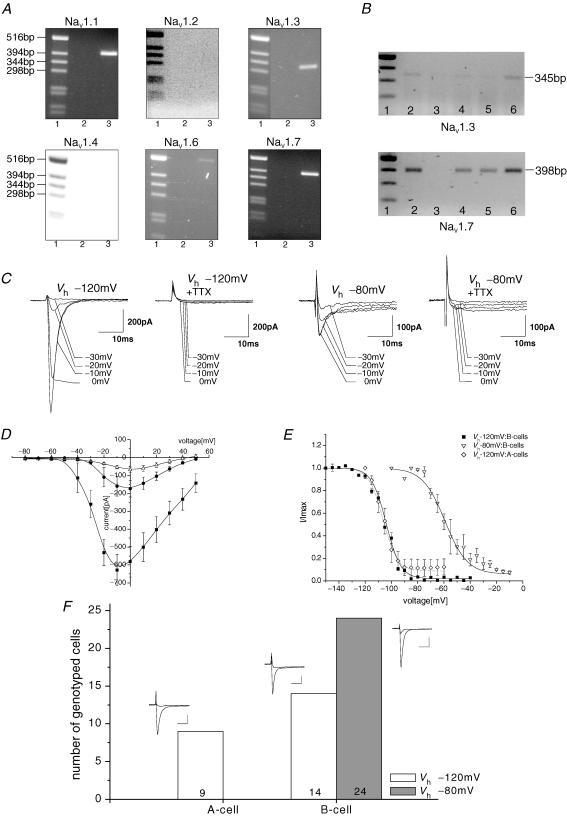
Insulin and glucagon are the major hormones of the islets of Langerhans that are stored and released from the B- and A-cells, respectively. Both hormones are secreted when the intracellular cytosolic Ca2+ concentration ([Ca2+]i) increases. The [Ca2+]i is modulated by mutual inhibition and activation of different voltage-gated ion channels. The precise interplay of these ion channels in either glucagon or insulin release is unknown, owing in part to the difficulties in distinguishing A- from B-cells in electrophysiological experiments. We have established a single-cell RT-PCR method to identify A- and B-cells from the mouse. A combination of PCR, RT-PCR, electrophysiology and pharmacology enabled us to characterize the different sodium and calcium channels in mouse islet cells. In both A- and B-cells, 60% of the inward calcium current (I(Ca)) is carried by L-type calcium channels. In B-cells, the predominant calcium channel is Ca(v)1.2, whereas Ca(v)1.2 and Ca(v)1.3 were identified in A-cells. These results were confirmed by using mice carrying A- or B-cell-specific inactivation of the Ca(v)1.2 gene. In B-cells, the remaining I(Ca) flows in equal amounts through Ca(v)2.1, Ca(v)2.2 and Ca(v)2.3. In A-cells, 30 and 15% of I(Ca) is due to Ca(v)2.3 and Ca(v)2.1 activity, respectively, whereas Ca(v)2.2 current was not found in these cells. Low-voltage-activated T-type calcium channels could not be identified in A- and B-cells. Instead, two TTX-sensitive sodium currents were found: an early inactivating and a residual current. The residual current was only recovered in a subpopulation of B-cells. A putative genetic background for these currents is Na(v)1.7.


Figures

Figure 1
Figure 1. Single pancreatic A- and B-cells of the mouse do not express LVA calcium channels
A, A- and B-cells can be distinguished by RT-PCR with glucagon- and insulin-specific primers. Lane 1, kb-ladder; lanes 2–6, RT-PCR of single islet cells with primer pairs Ins 5′, Ins 3′ and Gluc 5′, Gluc-3′; glucagon-specific band, 493 bp; insulin-specific band, 344 bp. B, PCR analysis of cDNA obtained from undissociated complete islets with LVA channel-specific primer pairs (see Methods). Lane 1, kb-ladder; lane 2, CaV3.1 (271 bp); lane 3, CaV3.2 (305 bp); and lane 4, CaV3.3 (258 bp). C, families of currents of a representative A-cell from holding potential (Vh) −80 (left) or −40 mV (middle) to potentials between −80 and +10 mV; right panel shows difference currents obtained by subtraction of the current measured at Vh−40 mV from the respective current at Vh−80 mV. D, mean current–voltage relationships (peak current versus voltage) measured in B-cells from a Vh of −80 mV (▪) and −40 mV (•); current–voltage relationship from difference currents obtained as described in Fig. 1C (▵); n = 6. E, RT-PCR analysis with LVA channel-specific primer pairs (CaV3.1, CaV3.2 and CaV3.3) on a single islet. Lane 1, kb-ladder. F, RT-PCR analysis with LVA channel-specific primer pairs on a single representative A-cell from a βCaV1.2−/− mouse. Lane 1, kb-ladder.
Figure 2
Figure 2. Two different sodium channels are expressed in pancreatic islet cells of the mouse
A, PCR analysis of cDNA obtained from undissociated complete islets with primer pairs specific for the known TTX-sensitive sodium channels (see Methods): lane 1, kb-ladder; lane 2, control (no cDNA); lane 3, islet cDNA. Primer specificity is given above each panel. B, RT-PCR on single islet cells. Cells were isolated and processed as described in the Methods. Single-cell RT-PCR was done with NaV1.3- (upper) and NaV1.7-specific primers (lower). Five representative cells are shown for each primer pair; lane 1, kb-ladder. C, representative current traces for the early inactivating and the residual sodium current from two different B-cells. One hundred millisecond currents were measured from a Vh of −120 or −80 mV to potentials from −30 to 0 mV from two different B-cells in the absence or presence of 0.1 μm TTX. D, mean current–voltage relations measured from a Vh of −120 mV (▪), a Vh of −80 mV (•) or a Vh of −120 mV in the presence of 0.1 μm TTX (▵; n = 8–11 each). Currents were measured as described above, averaged and plotted versus the appendant voltage. E, steady-state inactivation of the early inactivating and the residual sodium currents. Results are means ± s.e.m. The data were fitted by the Boltzmann equation. The smooth curve represents the averaged Boltzmann fit. Early inactivating sodium current: V0.5=−106 ± 1.7 mV, k = 5.4 ± 0.9, n = 4 (A-cells); V0.5=−104 ± 1.2 mV, k = 5.5 ± 0.3, n = 13 (B-cells); and residual sodium current: V0.5=−59 ± 3.3 mV, k = 8.5 ± 1.3, n = 6 (B-cells). F, identification of A- and B-cells expressing early inactivating (open bars) and residual sodium current (filled bar) with insulin- and glucagon-specific primers. Representative current traces from Vh−120 mV and Vh−80 mV to −10 or 0 mV are shown as insets for each type of cell. Scale bars, 10 ms, 200 pA.
Figure 3
Figure 3. CaV1.2 carries most of the IBa in mouse pancreatic A- and B-cells
A, RT-PCR analysis of cDNA obtained from undissociated complete islets with specific primers for L-type Ca2+ channels CaV1.1 (200 bp), CaV1.2 (316 bp) and CaV1.3 (556 bp) (lanes 2–4), and non-L-type Ca2+ channels CaV2.1 (333 bp), CaV2.2 (381 bp) and CaV2.3 (279 bp) (lanes 5–7), as well as kb-ladder (lane 1). B, RT-PCR analysis on single cells of pancreatic islets with specific primers for CaV1.2 (316 bp; Ba, lane 2), CaV2.1 (333 bp; Ba, lane 4), CaV2.2 (381 bp; Bb, lane 3) and CaV2.3 (279 bp; Bc, lane 3). More specific primers were designed for the identification of CaV1.3 with single-cell RT-PCR (dfor, drev; Table 2). A 380 kb piece was amplified (Bd). Lanes Ba1, Bb2, Bc2 and Bd2 show kb-ladder; lanes Ba3, Ba5, Bb1, Bc1 and Bd1 are controls (no DNA). C, isradipine block of IBa from single mouse A- (Ca) and B-cells (Cb). Peak IBa was measured during 200 ms depolarizations from −100 to +10 mV with 0.2 Hz under control conditions (▪) and in the presence of 0.03 (○), 0.1 (▵) and 1 μm isradipine (⋄). Cc shows a concentration–inhibition curve of the IBa inhibition by isradipine. The results for A- and B-cells were pooled because isradipine has similar effects on A- and B-cells. The smooth line is the fit of the experimental data calculated with the Hill equation. Isradipine blocked the IBa with an IC50 of 211 nm. The points are means ± s.e.m. (n = 4–14). D, A-cell-specific inactivation of the CaV1.2 gene. PCR analysis of genomic DNA from αCaV1.2−/− heart (lane 3), αCaV1.2−/− islets (lane 4) or αCaV1.2+/− islets (lane 5). Lane 1, kb-ladder; lane 2, no cDNA. E, IBa density in wild-type (wt; open bars) and αCaV1.2−/− (ko; hatched bars) pancreatic A-cells in the absence and presence of 1 μm isradipine (DHP). The results of wild-type and αCaV1.2+/− cells were combined. IBa was measured as indicated above. Data are given as means ± s.e.m. The values are significantly different (P < 0.001).
Figure 4
Figure 4. IBa of mouse pancreatic A- and B-cells is inhibited by different snail and spider venoms
Peak IBa was measured with 200 ms depolarization from −100 to +10 mV at a frequency of 0.2 Hz and plotted versus time. Time courses of the inhibition recorded in the absence (▪) or presence (□) of 0.2 μmω-agatoxin IVA (A), 1.6 μmω-conotoxin VIA (B) and 0.1 μm SNX 482 (C) in A-cells (a) and B-cells (b), respectively.
Figure 5
Figure 5. Mouse A- and B-cells express different HVA calcium channels
The figure summarizes the data presented in Figs 3 and 4. The current inhibition is drawn as percentage of the maximum current for n = 4–14 experiments. Inhibition of IBa in A- and B-cells, respectively, was: isradipine, 59 ± 3.4 and 58.6 ± 3.0%; ω-agatoxin IVA, 16.1 ± 4.4 and 15.5 ± 3.2%; ω-conotoxin VIA, 15.1 ± 2.4 and 0.36 ± 0.36% (P = 0.001); and SNX 482, 30 ± 4 and 18.1 ± 1.8% (P = 0.05).

References

    1. Andrikopoulos S, Massa CM, Aston-Mourney K, Funkat A, Fam BC, Hull RL, et al. Differential effect of inbred mouse strain (C57BL/6, DBA/2, 129T2) on insulin secretory function in response to a high fat diet. J Endocrinol. 2005;187:45–53. - PubMed
    1. Ashcroft FM, Proks P, Smith PA, Ammala C, Bokvist K, Rorsman P. Stimulus-secretion coupling in pancreatic beta cells. J Cell Biochem. 1994;55(Suppl.):54–65. - PubMed
    1. Ashcroft FM, Rorsman P. Electrophysiology of the pancreatic beta-cell. Prog Biophys Mol Biol. 1989;54:87–143. - PubMed
    1. Barg S. Mechanisms of exocytosis in insulin-secreting B-cells and glucagon-secreting A-cells. Pharmacol Toxicol. 2003;92:3–13. - PubMed
    1. Barg S, Galvanovskis J, Gopel SO, Rorsman P, Eliasson L. Tight coupling between electrical activity and exocytosis in mouse glucagon-secreting alpha-cells. Diabetes. 2000;49:1500–1510. - PubMed

Publication types