

doi: 10.1529/biophysj.105.077099.
Epub 2006 Mar 2.
Theoretical analysis of single-molecule force spectroscopy experiments: heterogeneity of chemical bonds
Affiliations
- PMID: 16513778
- PMCID: PMC1459525
- DOI: 10.1529/biophysj.105.077099
Item in Clipboard
Theoretical analysis of single-molecule force spectroscopy experiments: heterogeneity of chemical bonds
Biophys J.
.
Abstract
We show that the standard theoretical framework in single-molecule force spectroscopy has to be extended to consistently describe the experimental findings. The basic amendment is to take into account heterogeneity of the chemical bonds via random variations of the force-dependent dissociation rates. This results in a very good agreement between theory and rupture data from several different experiments.
Figures

Schematic illustration of dynamic AFM force spectroscopy: a single chemical bond, e.g., in a ligand-receptor complex, is connected via two flexible linker molecules with the tip of an AFM cantilever and a piezoelectric element. The latter pulls down the attached linker molecule at some constant velocity υ. The resulting elastic reaction force of the cantilever can be determined from the deflection of a laser beam. The main quantity of interest is the force value at the moment when the bond dissociates.
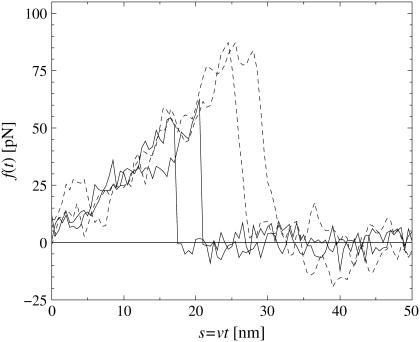
Force-extension curves of four representative single-molecule pulling experiments, two with pulling velocity υ = 100 nm/s (solid) and two with υ = 5000 nm/s (dashed), obtained by dynamic AFM force spectroscopy for the DNA fragment expE1/E5 and the regulatory protein ExpG (23). The abrupt drop of f(t) indicates dissociation of the chemical bond between expE1/E5 and ExpG. Apart from noise effects, the forces f(t) before dissociation (relevant in Eq. 1) collapse quite well to a single force-extension master-curve F(s); see Eq. 2. It can be noted that for a given pulling velocity, the rupture forces are distributed over a considerable range and that larger pulling velocities result in larger average dissociation forces.

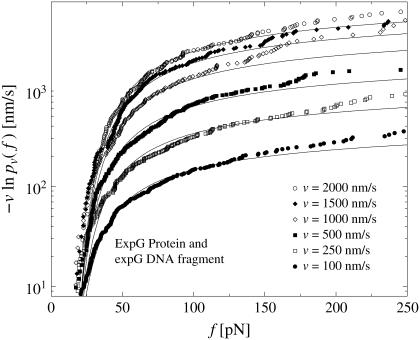
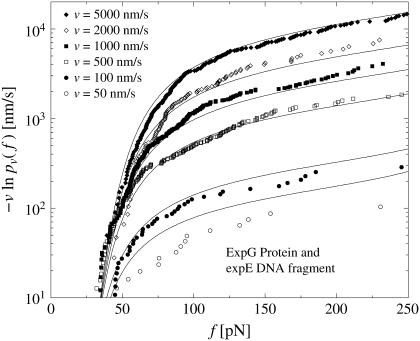
(Symbols) The functions  for different pulling velocities υ, obtained according to Eq. 4 from the same experiment (23) as in Fig. 2. Each depicted point corresponds to one rupture event at f = fn and hence a step of the piecewise constant function Eq. 4. Only fn above fmin = 20 pN have been taken into account; see discussion below Eq. 3. The number Nυ of experimental data points for the six different velocities υ in Eq. 4 are N50nm/s = 20; N100nm/s = 44; N500nm/s = 179; N1000nm/s = 208; N2000nm/s = 108; and N5000nm/s = 253. A few very small or large fn are omitted in this plot for the sake of better visibility of the remaining symbols. (Solid lines) Theoretical functions
  for the same pulling velocities υ as the symbols, using Eqs. 9, 11–16, and 21. For more details, see section Heterogeneity of Chemical Bonds.
Same symbols as in Fig. 3 but for dynamic AFM force spectroscopy data by Bartels et al. (23) for the dissociation of the DNA fragment expG1/G4 from the regulatory protein ExpG. (Symbols) The functions  for different pulling velocities υ, obtained according to Eq. 4 and taking into account only fn above fmin = 10 pN. (Solid lines) Theoretical functions
  for the same pulling velocities υ as the symbols, using Eqs. 9, 11–16, and 20.
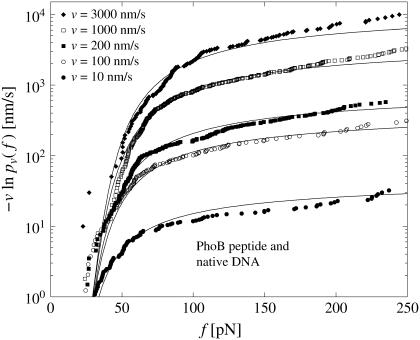
Same as in Fig. 3 but for dynamic AFM force spectroscopy data by Eckel et al. (24) for the dissociation of the PhoB peptide (wild-type) of E. coli from the DNA target sequence. (Symbols) The functions  for different pulling velocities υ, obtained according to Eq. 4 and taking into account only fn above fmin = 20 pN. (Solid lines) Theoretical functions
  for the same pulling velocities υ as the symbols, using Eqs. 9, 11–16, and 21.

Same as in Fig. 3 but for dynamic AFM force spectroscopy data by Eckel et al. (25) for the dissociation of a calixaren host molecule (resorc[4]arene) from a cationic guest (ammonium). (Symbols) The functions  for different pulling velocities υ, obtained according to Eq. 4 and taking into account only fn above fmin = 25 pN. (Solid lines) Theoretical functions
  for the same pulling velocities υ as the symbols, using Eqs. 9, 11–16, and 22.
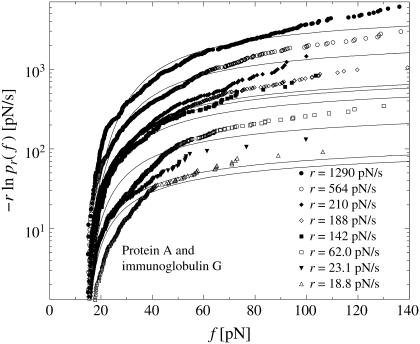
Same as in Fig. 3 but for micropipette-based force probe data by Nguyen-Duong et al. (19) for the dissociation of immunoglobulin of type G from protein A. (Symbols) The functions  for different loading rates r; see below Eq. 6, taking into account only fn above fmin = 15 pN. (Solid lines) Theoretical functions
  for the same loading rates r as the symbols, using Eqs. 7, 9, 11–16, and 23.
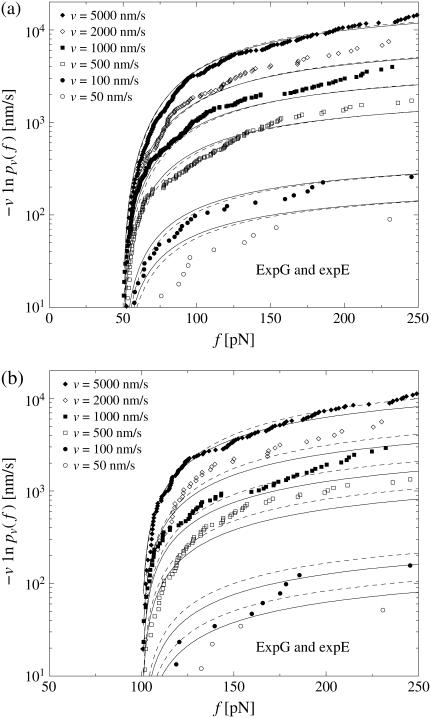
Same as in Fig. 3 except that in panel a, only fn above fmin = 50 pN and in panel b, only fn above fmin = 100 pN have been taken into account. The solid lines are the corresponding theoretical functions  using Eqs. 9, and 11–19. (Dashed lines) Same as solid lines but after refitting the parameters k0, αm, and σ to the given data subset, resulting in k0 = 0.000020 s−1, αm = 0.19 pN−1, σ = 0.095 pN−1 for panel a, and in k0 = 0.017 s−1, αm = 0.091 pN−1, σ = 0.040 pN−1 for panel b.
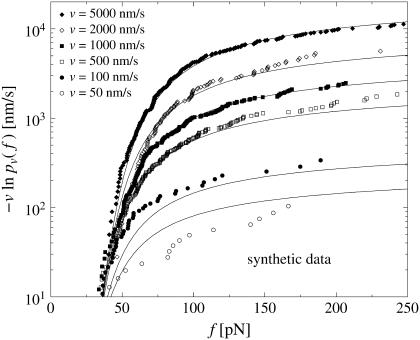
Same symbols as in Fig. 3 but for synthetic rupture data, sampled numerically according to Eqs. 9, and 11–19. The velocities υ and the number of rupture events Nυ for each υ are identical to those in Fig. 3.
(Symbols) Same experimental data as in Fig. 3. (Solid lines) Theoretical functions  for the same pulling velocities υ as the symbols, using Eqs. 8, 9, 11, 16, 34, and 36.
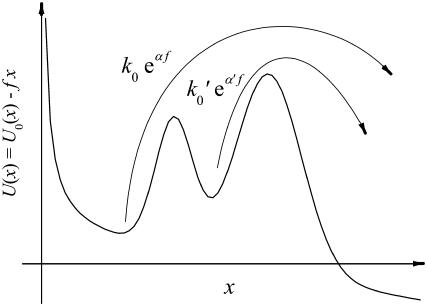
Sketch of the relevant dissociation rates of a chemical bond whose reaction coordinate x experiences a reaction potential U(x) with an intermediate energy barrier.
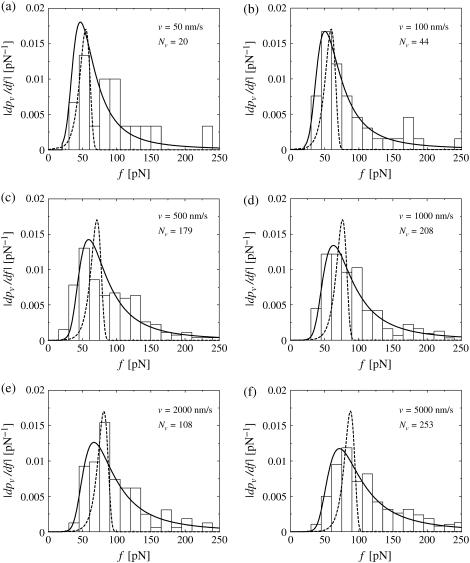
(Histograms) Same experimental rupture data as in Fig. 3 but represented as rupture force distributions. (Solid lines) Theoretical curves  according to Eqs. 9 and 11–19. (Dotted lines) Same but for k0 = 0.011 s−1, αm = 0.14 pN−1, σ = 0 pN−1, fmin = 0 (see main text), and with
  divided by a factor 3 for better visibility of the other curves.
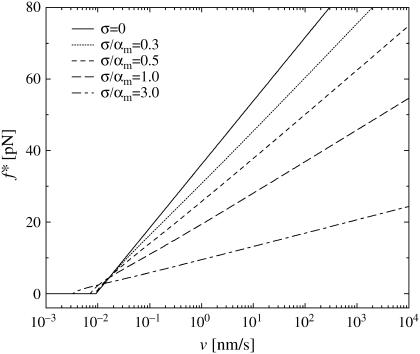
Most probable rupture force f* versus pulling velocity υ (logarithmic scale) by solving Eq. 37 numerically with Eq. 9, fmin = 0, Eqs. 11–16, k0 and αm from Eq. 19, and five different values of σ. For fmin > 0, the maximum of the plotted curves and fmin yield f*.

Same as Fig. 13, except that  in Eq. 17 rather than αm in Eq. 16 has been kept fixed to the value 0.135 pN−1.

Same as Fig. 14, except that f* was not determined according to Eq. 37 but rather by fitting the rupture force distributions  by Gaussian Eq. 39. (The fit was performed on the interval 0 ≤ f ≤ 250 pN.)
References
-
- Merkel, R. 2001. Force spectroscopy on single passive biomolecules and single biomolecular bonds. Phys. Rep. 346:343–385.
-
- Evans, E. 2001. Probing the relation between force, lifetime, and chemistry in single biomolecular bonds. Annu. Rev. Biomol. Struct. 30:105–128. - PubMed
-
- Florin, E.-L., V. T. Moy, and H. E. Gaub. 1994. Adhesion forces between individual ligand-receptor pairs. Science. 264:415–417. - PubMed
-
- Lee, G., L. A. Chrisey, and R. J. Colton. 1994. Direct measurement of the interaction forces between complementary strands of DNA with atomic force microscopy. Science. 266:771–775. - PubMed
-
- Dammer, U., O. Popescu, P. Wagner, D. Anselmetti, H.-J. Güntherodt, and G. N. Misevic. 1995. Binding strength between cell adhesion proteoglycans measured by atomic force microscopy. Science. 267:1173–1175. - PubMed
Publication types
MeSH terms
LinkOut - more resources
Full Text Sources
Other Literature Sources
