. 2006;11(3):183-97.
doi: 10.1159/000091815. Epub 2006 Mar 2.

The effect of methodological differences in the measurement of stapes motion in live and cadaver ears

Affiliations

The effect of methodological differences in the measurement of stapes motion in live and cadaver ears

Wade Chien et al. Audiol Neurootol. 2006.

Abstract

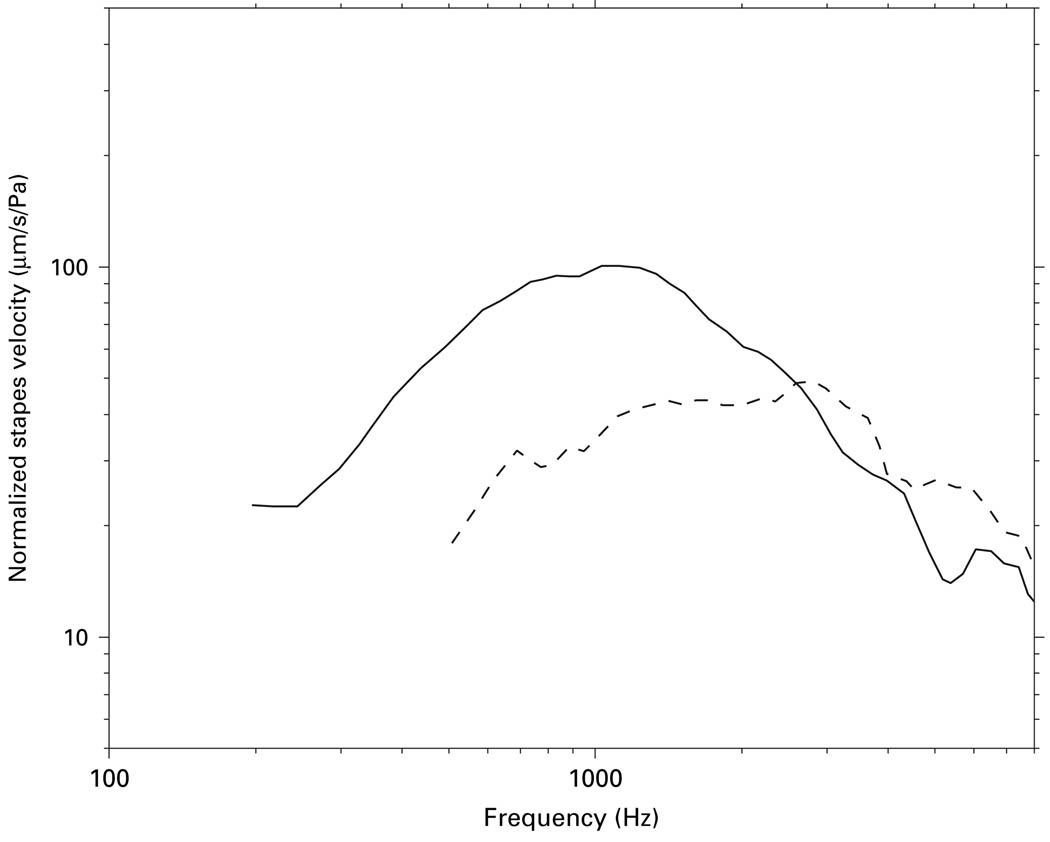
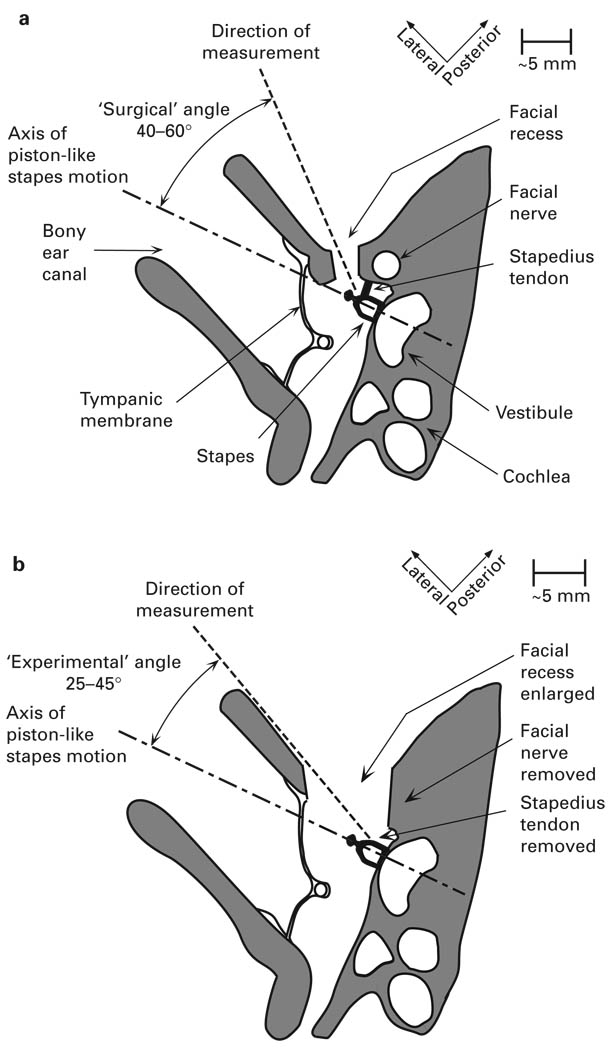
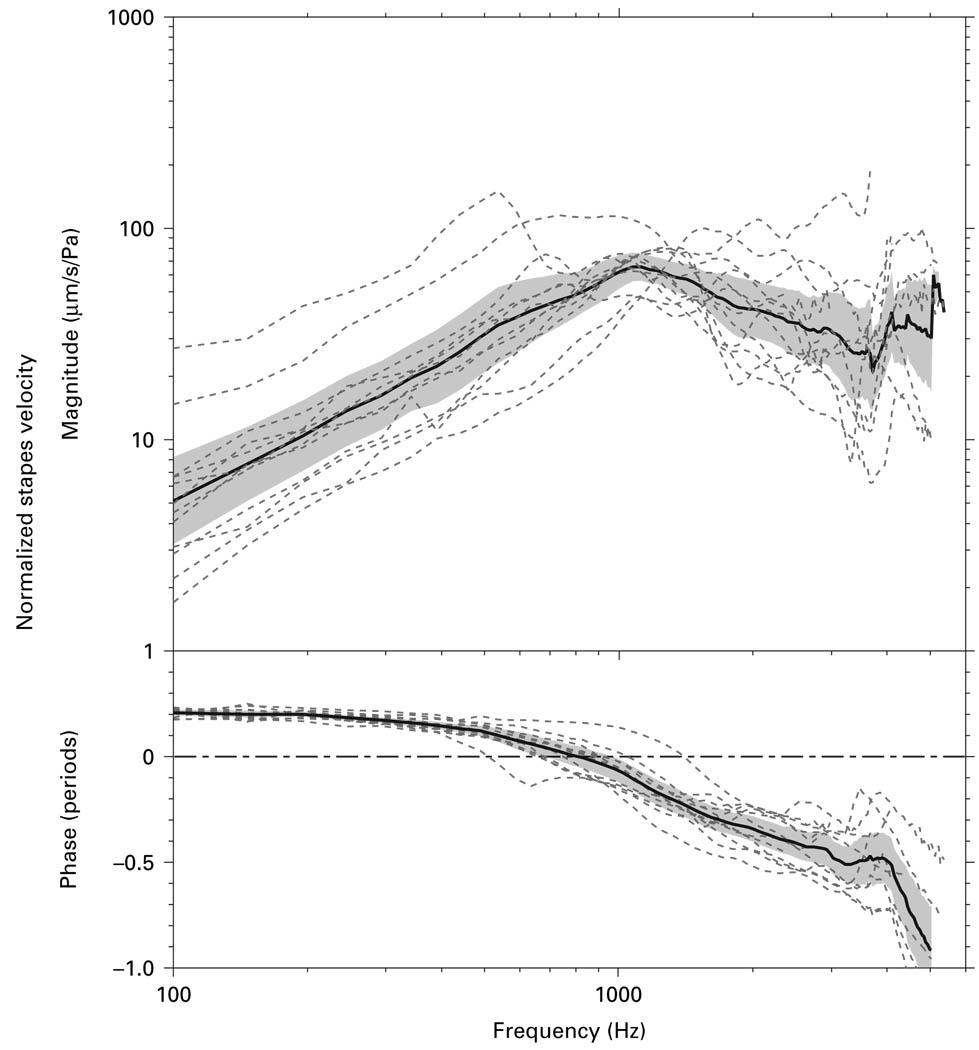
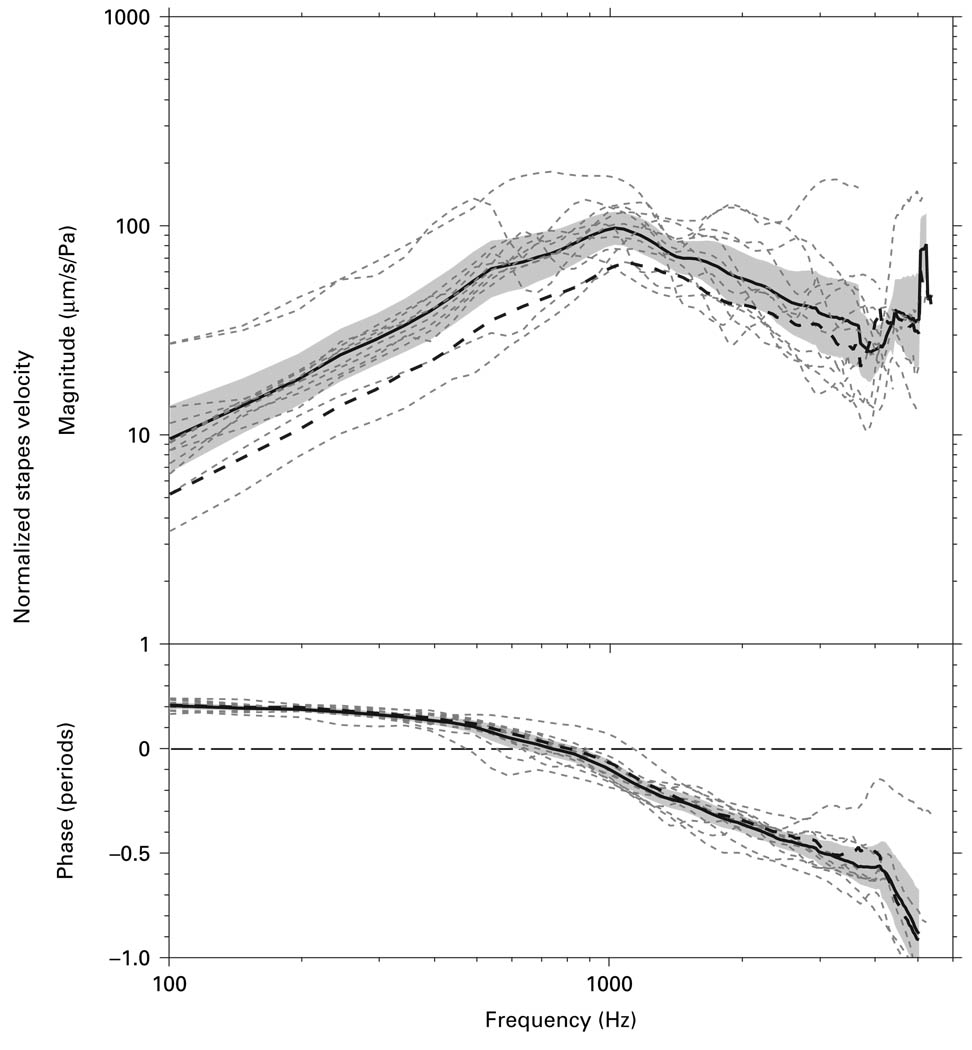
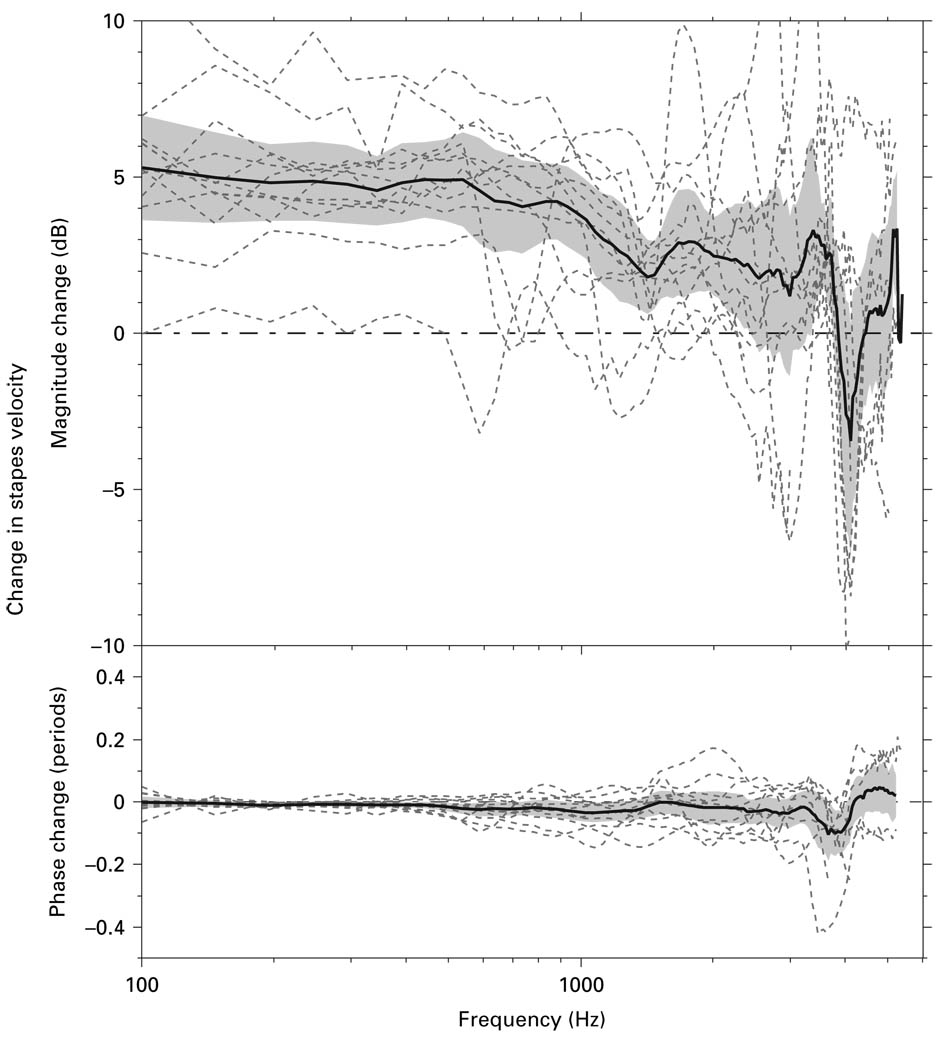
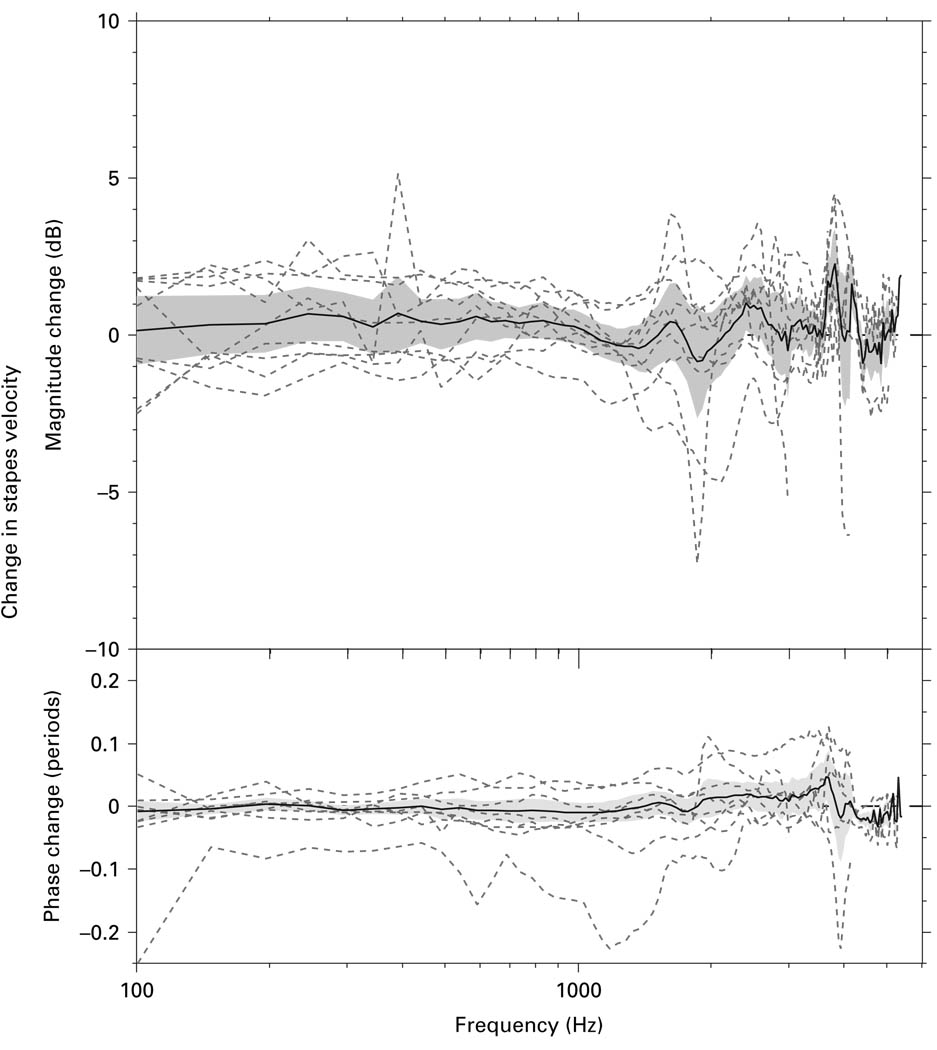
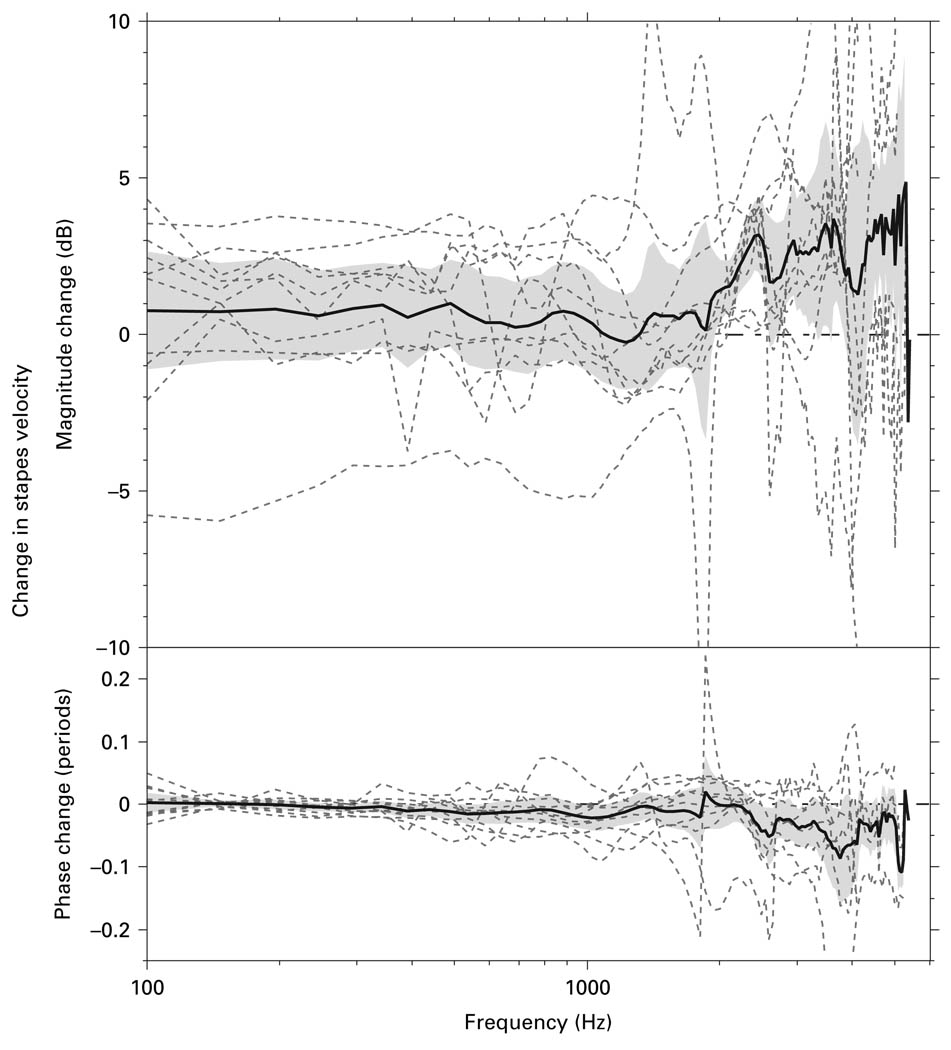
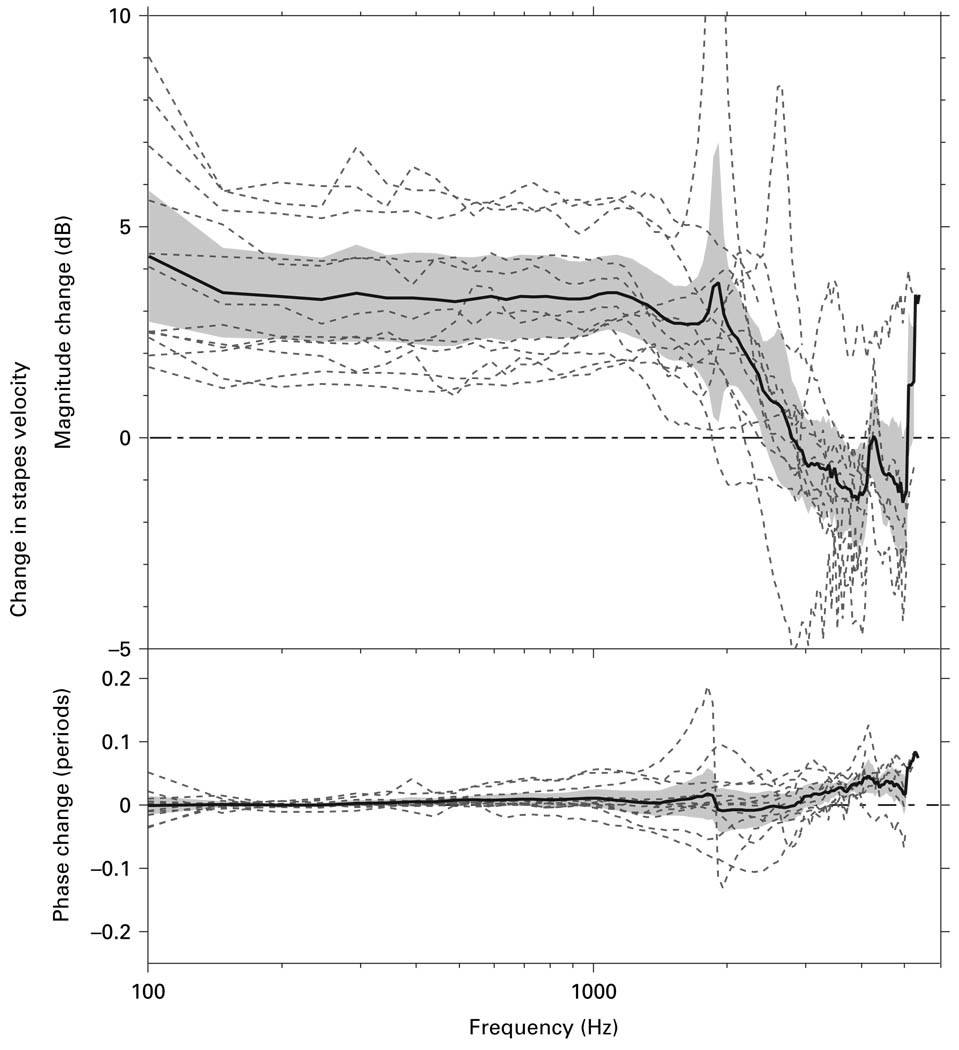
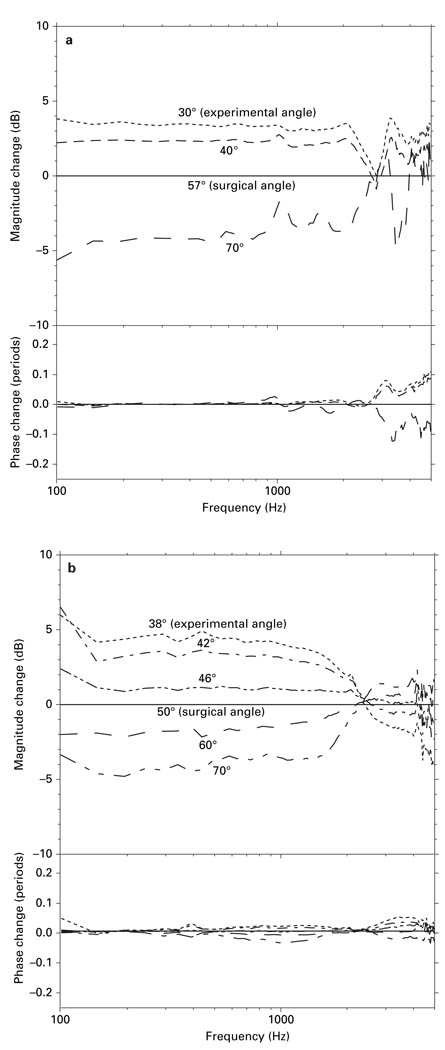
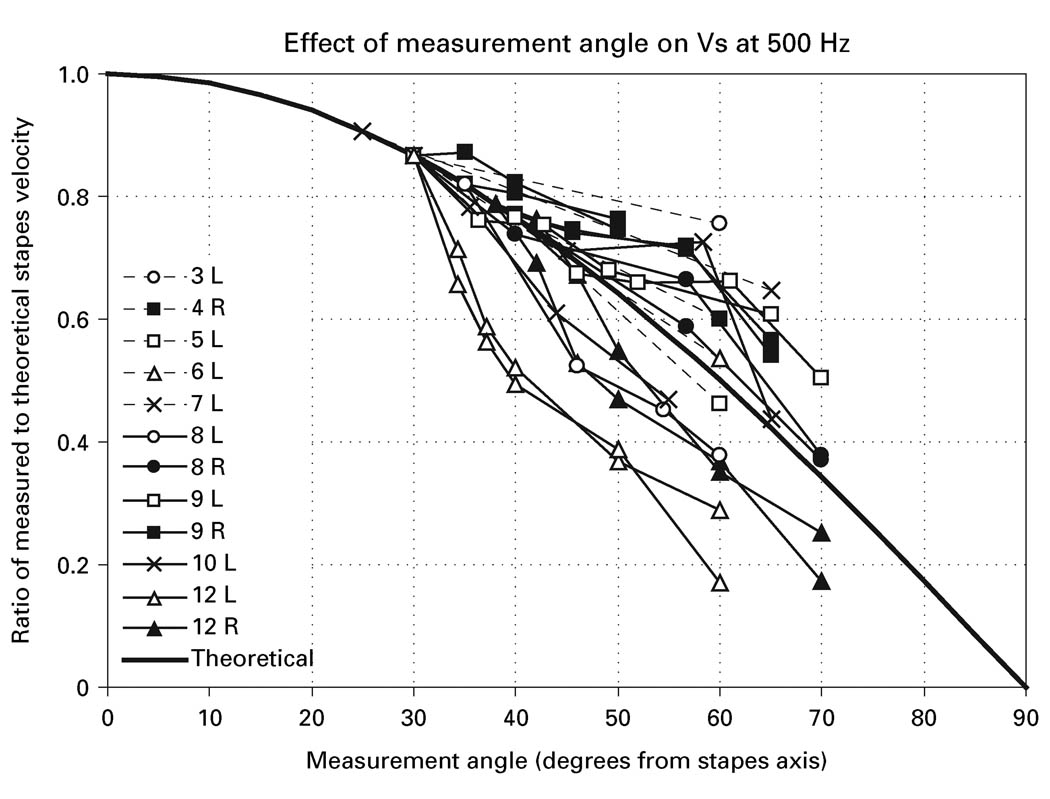
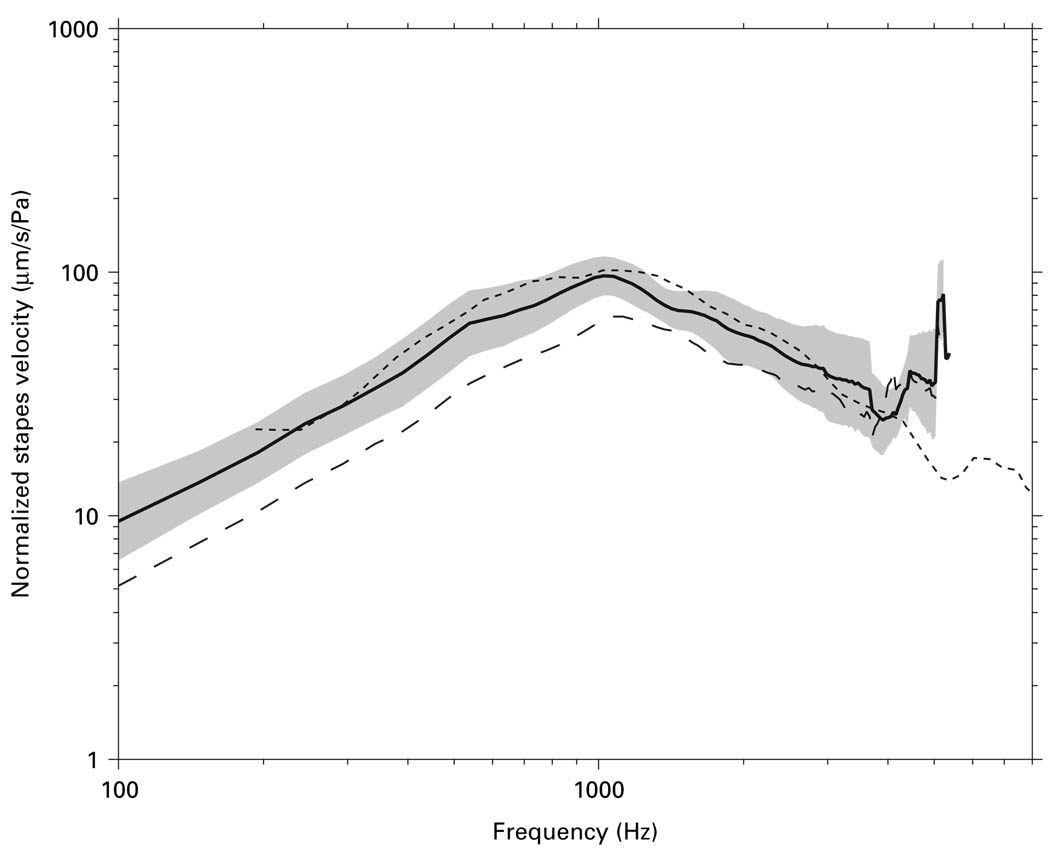
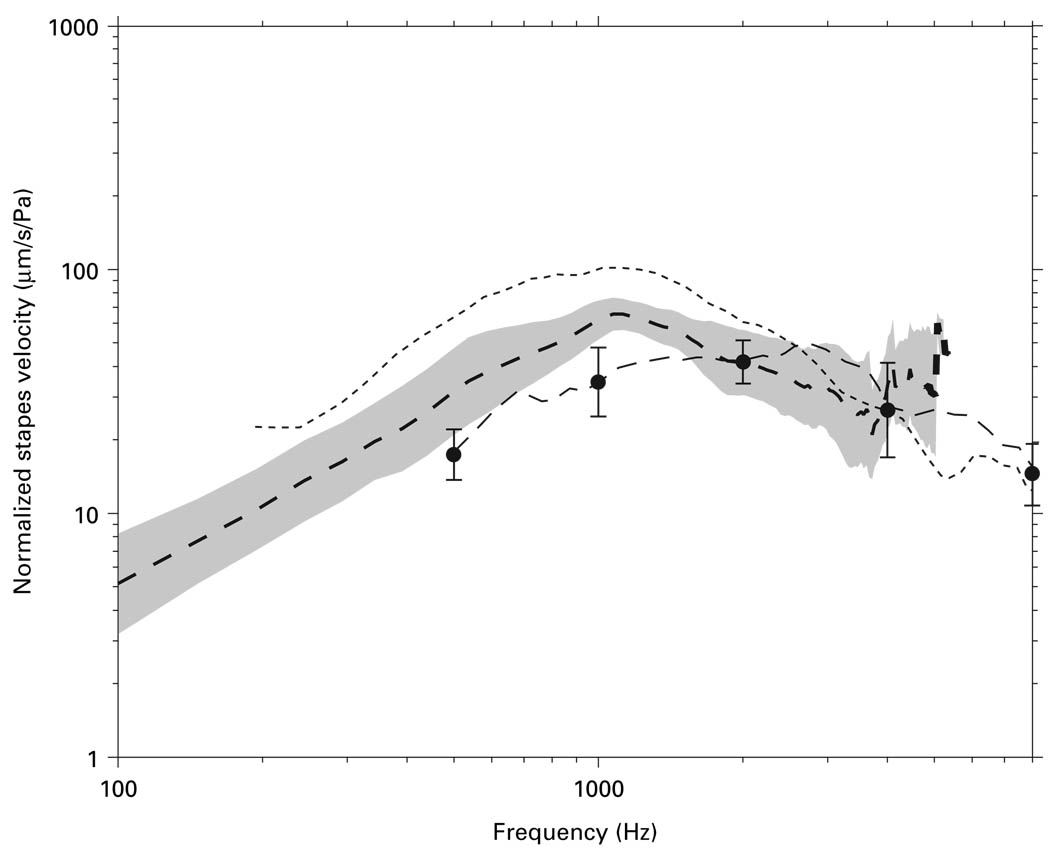
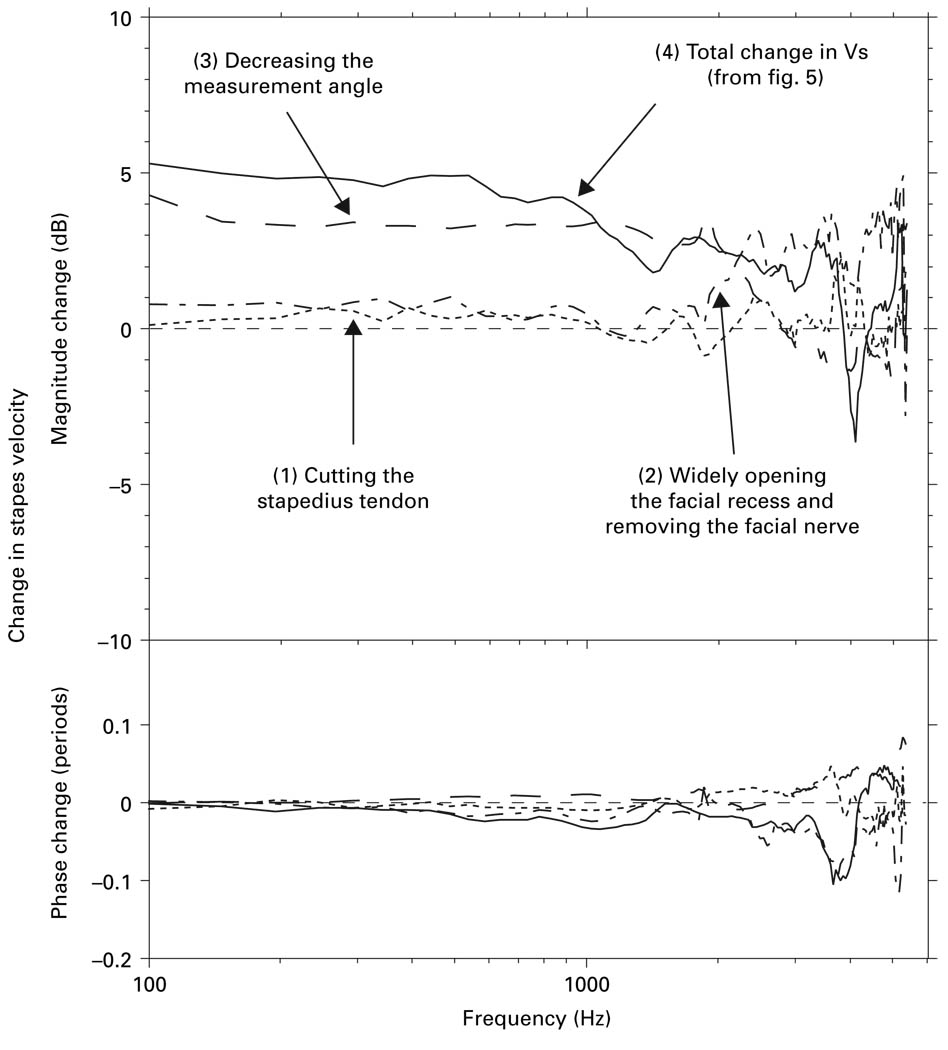
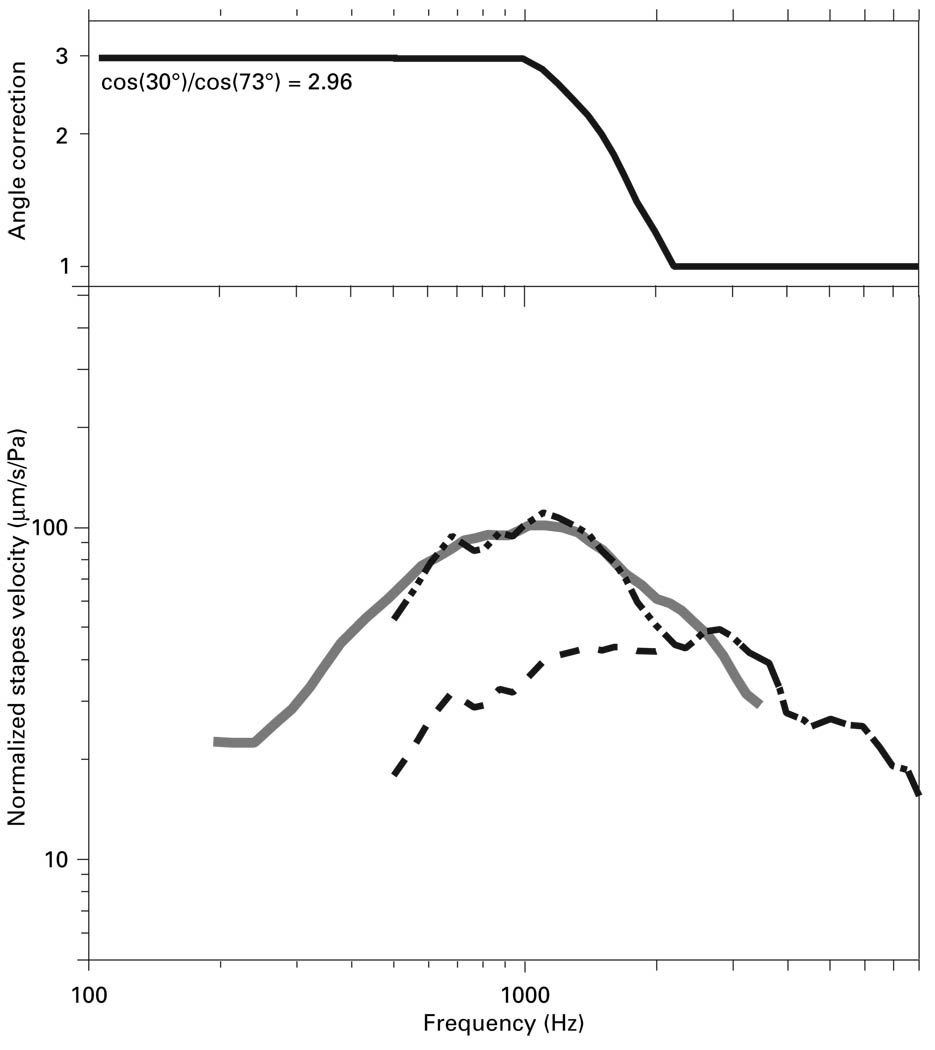
Methodological differences in sound-induced stapes velocity (Vs) measurements in live and cadaveric ears were examined using fresh cadaveric temporal bones. On average, differences in preparation (sectioning the stapedius tendon, removing the facial nerve, and widely opening the facial recess) had statistically insignificant effects on measured Vs. Differences in the achievable measurement angle (with respect to the axis of piston-like stapes motion) had a significant effect on measured Vs below 2 kHz. These results suggest that much if not all of the differences in Vs measurements between live and cadaveric ears can be explained by the differences in measurement angle between the two preparations. Measurement angle was found to have minimal effect on measured Vs above 2 kHz. This demonstrates that the commonly used method of estimating stapes translational velocity by dividing the measured velocity by the cosine of the measurement angle is not valid above 2 kHz.


Figures

Fig. 1
Fig. 1
Mean Vs magnitude in live (dashed line) and cadaveric (solid line) ears as reported by Huber et al. [2001] and Asai et al. [1999], respectively. Data were originally presented as peak-to-peak stapes displacements; stapes velocities relative to stimulus sound pressure were computed by taking the derivatives of the displacements, converting them to RMS values, and then normalizing by the RMS sound stimulus level.
Fig. 2
Fig. 2
a Schematic of a section through a temporal bone illustrating the ‘surgical’ approach and the ‘surgical’ measurement angle. b Schematic of a section through a temporal bone illustrating the ‘experimental’ approach and the ‘experimental’ angle. In the ‘experimental’ approach, the stapedius tendon and the mastoid segment of the facial nerve were removed, and the facial recess was widely opened.
Fig. 3
Fig. 3
Vs measured by the ‘surgical’ approach in 12 temporal bones (dashed lines), as well as the mean (solid line) and 95% CI around the mean (shaded area).
Fig. 4
Fig. 4
Vs measured by the ‘experimental’ approach with the ‘experimental’ angle in 12 temporal bones (dashed lines), as well as the mean (solid line) and 95% CI around the mean (shaded area). The mean Vs measured by the ‘surgical’ approach (thick dashed line) from figure 3 are also shown for comparison.
Fig. 5
Fig. 5
The ΔVs between Vs measured by the ‘experimental’ approach with the ‘experimental’ angle to that measured by the ‘surgical’ approach in 12 temporal bones (dashed lines). The mean (solid line) and the 95% CI around the mean (shaded area) are also shown. Magnitude change was computed as 20 times the log 10 of the ratio of the magnitudes (‘experimental’ Vs/‘surgical’ Vs). Phase change computed from the difference between the phases of the ‘experimental’ Vs and ‘surgical’ Vs.
Fig. 6
Fig. 6
The ΔVs in 9 bones produced by cutting the stapedius tendon (dashed lines), along with the mean (solid line) and 95% CI around the mean (shaded area).
Fig. 7
Fig. 7
The ΔVs in 10 bones (dashed lines) produced by opening of the facial recess and removing the mastoid segment of the facial nerve, along with the mean (solid line) and 95% CI around the mean (shaded area).
Fig. 8
Fig. 8
The ΔVs produced by changing the measurement angle in temporal bones from the ‘surgical’ angle of 40–60° to the ‘experimental’ angle of 25–45°. Data are shown for 12 bones (dashed lines), along with the mean (solid line) and 95% CI around the mean (shaded area).
Fig. 9
Fig. 9
a The ΔVs in one temporal bone (8R in figure 10) when the measurement angle was changed from large to small with respect to the axis of piston-like stapes motion. All measurements were normalized by the ‘surgical’ angle measurement in this bone (57°). b The ΔVs in one temporal bone (12R in figure 10) when the measurement angle was changed from large to small with respect to the axis of piston-like stapes motion. All measurements were normalized by the ‘surgical’ angle measurement in this bone (50°).
Fig. 10
Fig. 10
The difference in measured Vs at 500 Hz in 12 temporal bones at various measurement angles (symbols and thin lines) compared with the theoretical difference in Vs computed as the cosine of the measurement angle (thick solid line). ΔVs is computed relative to piston-like stapes motion (0°) predicted from Vs measured at the experimental angle as described in the text.
Fig. 11
Fig. 11
Mean Vs magnitude measured by the ‘experimental’ approach with the ‘experimental’ angle in the present study (solid line) and the 95% CI around the mean (shaded area) compared with the mean Vs measured in 22 cadaveric temporal bones by Asai et al. [1999] (dotted line). The mean Vs measured by the ‘surgical’ approach in the present study (dashed line) is also shown.
Fig. 12
Fig. 12
Mean Vs magnitude measured by the ‘surgical’ approach (dashed line) and its 95% CI (shaded area) of the present study compared with the mean live Vs measured by Huber et al. [2001] (dot-dashed line). The 95% CIs for live Vs at 500, 1000, 2000, and 4000 Hz are shown as the error bars. The mean cadaveric Vs measured by Asai et al. [1999] (dotted line) is also included for comparison.
Fig. 13
Fig. 13
Contributions of mean changes in Vs to the total Vs between ‘experimental’ and ‘surgical’ approaches by different steps in the preparation procedure: (1) cutting the stapedius tendon; (2) removing the facial nerve and opening the facial recess widely; (3) decreasing the measurement angle. Total change in Vs (4) is taken from figure 5.
Fig. 14
Fig. 14
Effect of a frequency-dependent measurement angle correction on Vs measured in live ears. Top panel: The multiplicative correction factor is illustrated. At frequencies below 1000 Hz the correction has a magnitude of 2.96 (9.4 dB) as might occur if the ‘experimental’ and ‘surgical’ angles were 30° and 74°, respectively. No correction (a correction factor of 1) is applied at frequencies above 2000 Hz. A linear decrease in the correction factor is assumed between 1000 and 2000 Hz. Bottom panel: The cadaveric Vs data of Asai et al. [1999] (solid gray line) are compared with the original live Vs data of Huber et al. [2001] (dashed data curve) and the Huber data corrected by the multiplicative factor described in the top panel (the dot-dash line).

References

    1. Asai M, Huber A, Goode R. Analysis of the best site on the stapes footplate for ossicular chain reconstruction. Acta Otolaryngol (Stockh) 1999;119:356–361. - PubMed
    1. Decraemer WF, Khanna SM. Measurement, visualization and quantitative analysis of complete three-dimensional kinematical data sets of human and cat middle ear. In: Gyo K, Wada H, Hato N, Koike T, editors. Middle Ear Mechanics in Research and Otology. Singapore: World Scientific; 2004. pp. 3–10.
    1. Goode RL, Ball G, Nishihara S. Measurement of umbo vibration in human subjects – method and possible clinical applications. Am J Otol. 1993;14:247–251. - PubMed
    1. Goode RL, Ball G, Nishihara S, Nakamura K. Laser Doppler vibrometer (LDV) – a new clinical tool for the otologist. Am J Otol. 1996;17:813–822. - PubMed
    1. Gyo K, Aritomo H, Goode RL. Measurement of the ossicular vibration ratio in human temporal bones by use of a video measuring system. Acta Otolaryngol. 1987;103:87–95. - PubMed

Publication types

LinkOut - more resources