. 2006 Apr;4(4):e90.
doi: 10.1371/journal.pbio.0040090. Epub 2006 Mar 14.

Inefficient cytotoxic T lymphocyte-mediated killing of HIV-1-infected cells in vivo

Affiliations

Inefficient cytotoxic T lymphocyte-mediated killing of HIV-1-infected cells in vivo

Becca Asquith et al. PLoS Biol. 2006 Apr.

Abstract

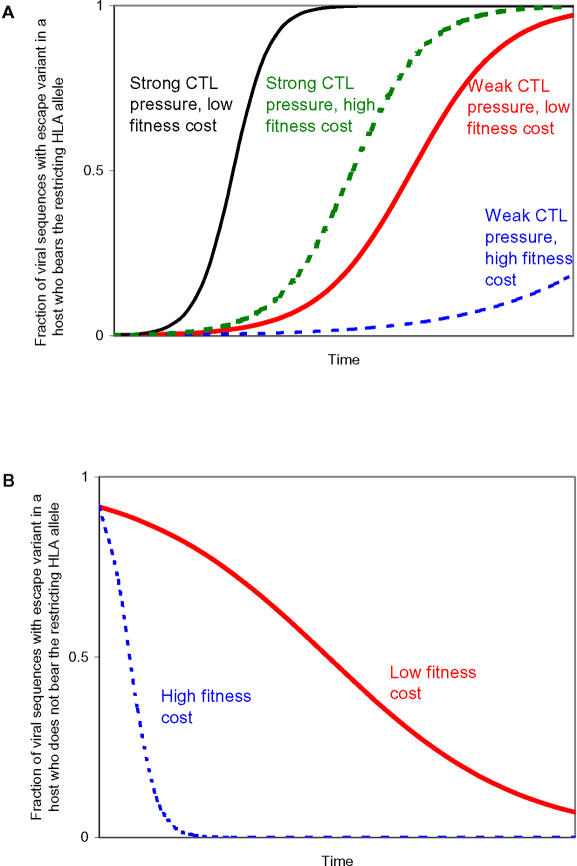
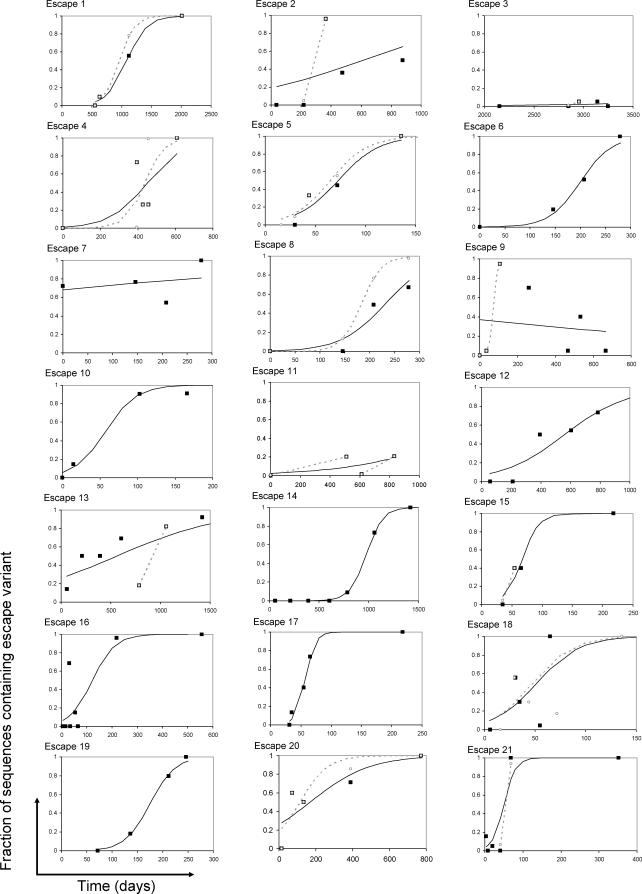
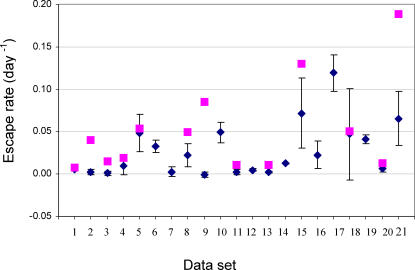
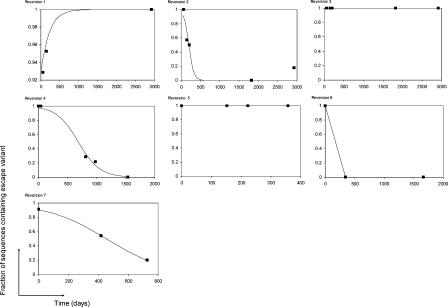
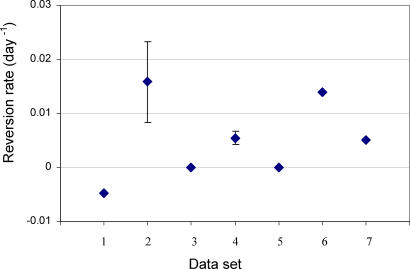
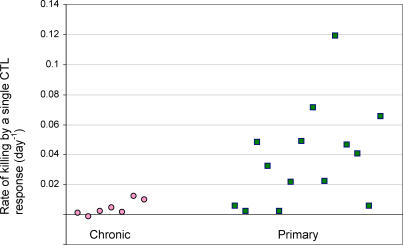
Understanding the role of cytotoxic T lymphocytes (CTLs) in controlling HIV-1 infection is vital for vaccine design. However, it is difficult to assess the importance of CTLs in natural infection. Different human leukocyte antigen (HLA) class I alleles are associated with different rates of progression to AIDS, indicating that CTLs play a protective role. Yet virus clearance rates following antiretroviral therapy are not impaired in individuals with advanced HIV disease, suggesting that weakening of the CTL response is not the major underlying cause of disease progression and that CTLs do not have an important protective role. Here we reconcile these apparently conflicting studies. We estimate the selection pressure exerted by CTL responses that drive the emergence of immune escape variants, thereby directly quantifying the efficiency of HIV-1-specific CTLs in vivo. We estimate that only 2% of productively infected CD4+ cell death is attributable to CTLs recognising a single epitope. We suggest that CTLs kill a large number of infected cells (about 10(7)) per day but are not responsible for the majority of infected cell death.


Figures

Figure 1
Figure 1. Calculating the Rate of CTL Killing
We need to know how important CTLs are in the control of HIV-1 infection, but it is not possible to measure the rate at which CTLs kill HIV-1–infected cells in vivo using conventional assays. Here we develop an alternative approach. CTL selection pressure drives viral escape, so a surrogate marker of the importance of CTLs is the rate at which CTL escape variants replace the wild-type. (A) In a host bearing the restricting HLA allele a CTL escape variant grows more rapidly than and replaces the wild-type because it is subject to a lower rate of CTL killing. The rate of replacement of the wild-type by the escape variant, “the escape rate,” is equal to the difference in growth rate of the wild-type and escape variant. If everything else were equal, the difference in growth rate would be equal to the difference in the CTL killing rate of the wild-type and the escape variant. This would mean that the CTL pressure on the specific epitope that has undergone mutation (the “escape epitope”) could be measured by the escape rate. However, everything else is not equal. Many escape variants will carry a fitness cost, which will slow the growth rate of the escape variant and thus decrease the escape rate. This fitness cost is revealed as the reversion rate when the variant is transferred to a host who does not bear the restricting HLA (B). The escape rate will therefore be equal to the rate of lysis by CTLs targeting the escape epitope minus the fitness cost. Expressed in a different way, the rate of lysis of HIV-1–infected cells by CTLs targeting the escape epitope is equal to the escape rate plus the reversion rate. In (A) the relative position of the two lines “strong CTL pressure, high fitness cost” and “weak CTL pressure, low fitness cost” could be interchanged depending on the magnitude of the differences in CTL strength and variant fitness.
Figure 2
Figure 2. Escape Data and Theoretical Fits
Fit of the model to the experimental data for each of the 21 escape datasets. Best (filled squares) and optimistic (open circles) data and the fit of the model (solid line and dashed line, respectively) to the data. Best estimates of the escape rate of a variant were obtained by fitting the model to the published data. Maximal, “optimistic” estimates of CTL efficiency were also made by omitting data or including mutations that have not been shown to confer escape (e.g., in the case of fluctuating variant frequencies rather than steady outgrowth a more optimistic estimate can often be obtained if some later data are discarded, e.g., Escape 9). These maximal estimates are less accurate but they provide an approximate upper bound on the rate of escape.
Figure 3
Figure 3. Escape Rate Estimates
Best (filled diamonds) and optimistic (filled squares) estimates of the rate of escape in each of the 21 datasets. Best estimates are shown ±1 standard error.
Figure 4
Figure 4. Reversion Data and Theoretical Fits
Fit of the model (solid line) to the experimental data (filled square) for each of the seven reversion datasets.
Figure 5
Figure 5. Reversion Rate Estimates
Best (filled diamonds) estimates of the reversion rate in each of the seven datasets. Best estimates are shown ±1 standard error. Escape and reversion may require additional compensatory mutations which will limit the occurrence of escape or reversion and will delay the time until escape or reversion occurs. The effect of such compensatory mutations (even if they occur outside of the epitope) will be fully quantified because their effect will be reflected in the rate of escape/reversion of the variant. It is also possible that compensatory mutations will be acquired after the wild-type has been completely replaced by the escape variant. Interestingly, escape 7 and reversion 5 are “paired.” That is, the outgrowth of the escape variant labeled 7 was observed in one individual (the “donor”) who transmitted the escape variant to their sexual partner (the “recipient”), and in whom the escape variant then reverted (reversion 5). Outgrowth of the escape variant was observed in the donor during the time at which the recipient was infected. Both the escape and reversion rates are typical and lie within the range of the other observed escape/reversion rates, implying that low reversion rates cannot be attributed to the accumulation of compensatory mutations following escape.
Figure 6
Figure 6. The Rate of CTL Killing Is Significantly Lower in Individuals with Long-Term Infection
Individuals with chronic infection (filled circles) have weaker single CTL responses than individuals with primary infection (filled squares). The median rate of lysis of productively infected cells was 0.008 d −1 in chronic infection and 0.04 d −1 in primary infection. The rate of CTL lysis was significantly lower in individuals with long-term infection (Wilcoxon–Mann-Whitney p = 0.004 two-tailed). Chronic infection was defined as infection in which the viral set point has been attained; primary infection as early infection prior to stabilisation of viral load which will include both seropositive and seronegative individuals.

Comment in

References

    1. Markowitz M, Louie M, Hurley A, Sun E, Di Mascio M, et al. A novel antiviral intervention results in more accurate assessment of human immunodeficiency virus type 1 replication dynamics and T-cell decay in vivo. J Virol. 2003;77:5037–5038. - PMC - PubMed
    1. Wei X, Ghosh SK, Taylor ME, Johnson VA, Emini EA, et al. Viral dynamics in human immunodeficiency virus type 1 infection. Nature. 1995;373:117–122. - PubMed
    1. Ho DD, Neumann AU, Perelson AS, Chen W, Leonard JM, et al. Rapid turnover of plasma virions and CD4 lymphocytes in HIV-1 infection. Nature. 1995;373:123–126. - PubMed
    1. Perelson AS, Neumann AU, Markowitz M, Leonard JM, Ho DD. HIV-1 dynamics in vivo: Virion clearance rate, infected cell life-span, and viral generation time. Science. 1996;271:1582–1586. - PubMed
    1. Rodrigo AG, Shpaer EG, Delwart EL, Iversen AK, Gallo MV, et al. Coalescent estimates of HIV-1 generation time in vivo. Proc Natl Acad Sci U S A. 1999;96:2187–2191. - PMC - PubMed

Publication types