. 2006 Mar 3:7:40.
doi: 10.1186/1471-2164-7-40.

Gene connectivity, function, and sequence conservation: predictions from modular yeast co-expression networks

Affiliations

Gene connectivity, function, and sequence conservation: predictions from modular yeast co-expression networks

Marc R J Carlson et al. BMC Genomics. .

Abstract

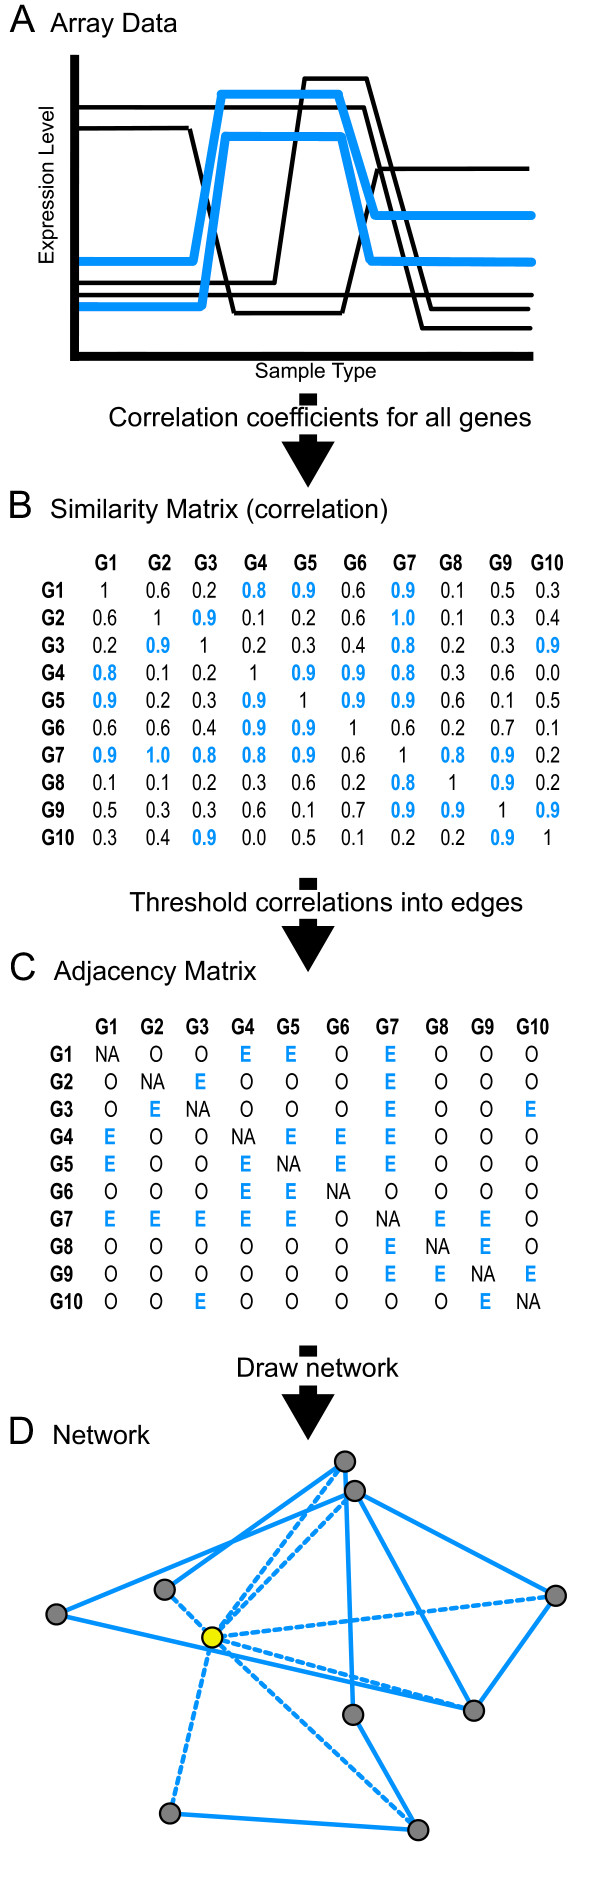
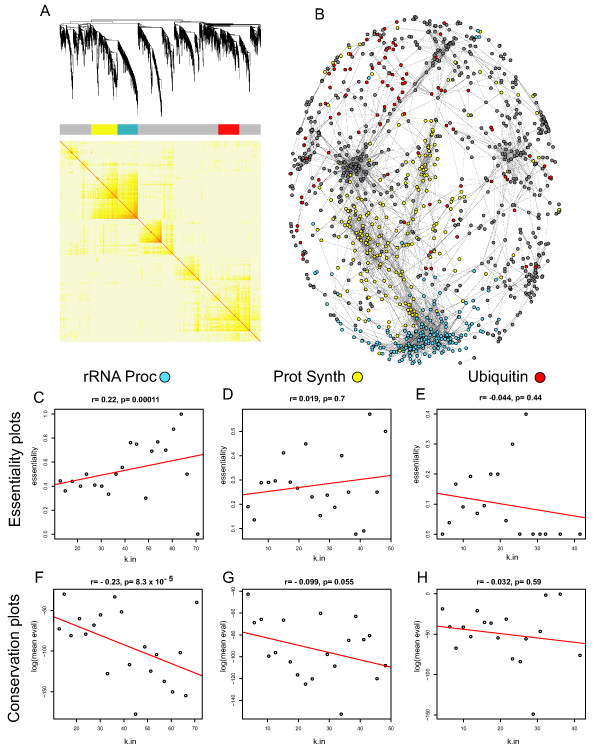
Background: Genes and proteins are organized into functional modular networks in which the network context of a gene or protein has implications for cellular function. Highly connected hub proteins, largely responsible for maintaining network connectivity, have been found to be much more likely to be essential for yeast survival.

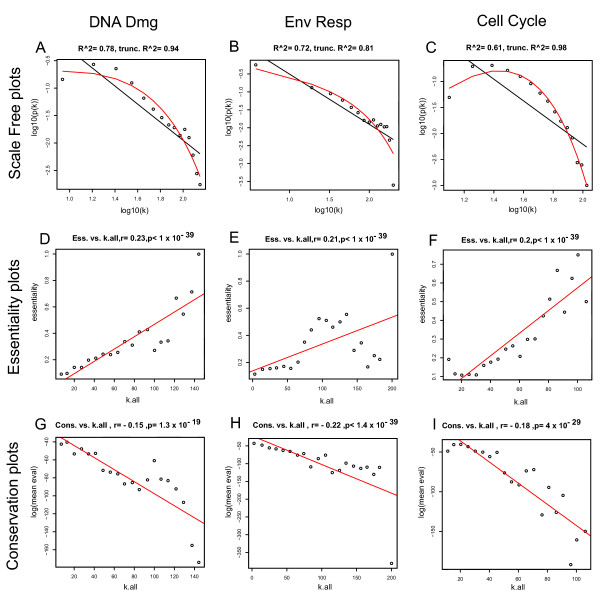
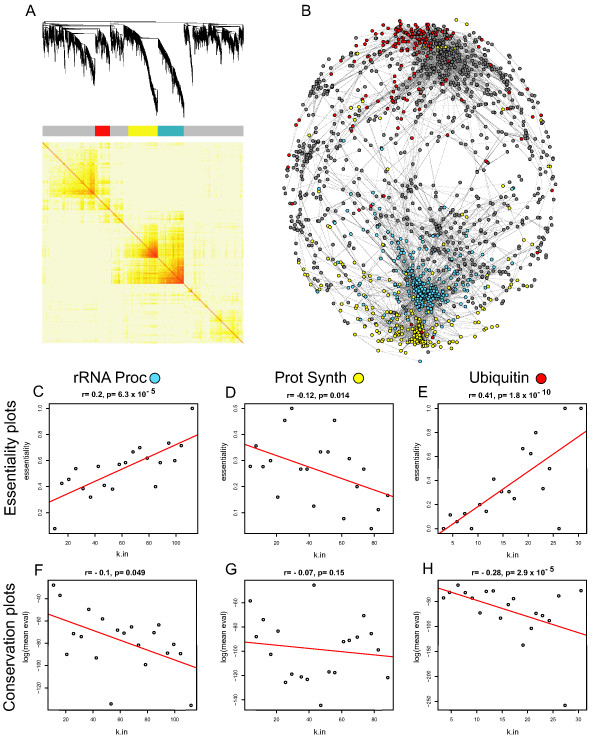
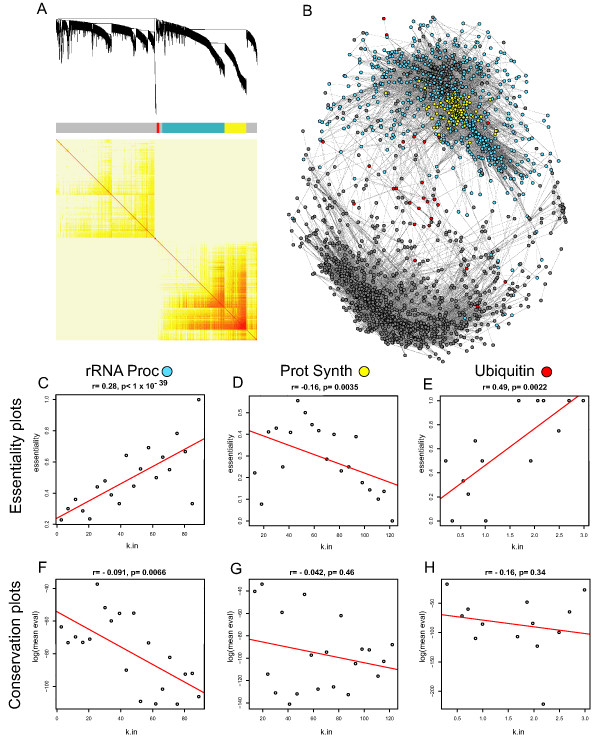
Results: Here we investigate the properties of weighted gene co-expression networks formed from multiple microarray datasets. The constructed networks approximate scale-free topology, but this is not universal across all datasets. We show strong positive correlations between gene connectivity within the whole network and gene essentiality as well as gene sequence conservation. We demonstrate the preservation of a modular structure of the networks formed, and demonstrate that, within some of these modules, it is possible to observe a strong correlation between connectivity and essentiality or between connectivity and conservation within the modules particularly within modules containing larger numbers of essential genes.

Conclusion: Application of these techniques can allow a finer scale prediction of relative gene importance for a particular process within a group of similarly expressed genes.


Figures

Figure 1
Figure 1
Generating a gene co-expression network. (A) Illustration to show how genes that are highly correlated (blue) will look across a dataset. (B-C) Flow chart for defining a gene co-expression network based on a simple Pearson correlation matrix. (D) An example visualization of a network produced by using the Fruchterman Rheingold algorithm on the data in Figure 1B and 1C. The node highlighted in yellow, is an example of the kind of highly connected node that this study shows is more likely to be an essential gene for survival.
Figure 2
Figure 2
Global gene co-expression networks. (A-C) Log-log plots of connectivity distributions in each of the three networks drawn from DNA Damage, Environmental Response, and Cell Cycle, respectively. The linear relationship indicates a scale-free structure. (D-F) Correlation plots showing the relationship between gene group connectivity and essentiality in the same order as A-C. On the y axis of these plots is the percentage of genes determined to be essential in yeast. (G-I) Relationship between the average blastp score of a node and k for all datasets in the same order as A-C. On the y axis of these plots is the average log(e score) of genes within that bin. For plots D-I, the connectivity within each network for each gene was determined and each gene rank ordered by connectivity. 20 equal sized bins for each of the expression datasets were formed and the average connectivity of the genes in each bin plotted on the X axis
Figure 3
Figure 3
A co-expression network of the DNA Damage dataset. For all panels in the figure: blue color represents members of the rRNA processing module, yellow color represents members of the protein synthesis module and red color represents members of the ubiquitin pathway. (A) A hierarchical clustering of the topological overlap matrix for the DD dataset. (B) A drawn network of gene co-expression from the DD dataset. Edges were computed from the Pearson correlation coefficients. Network structure was drawn in Pajek [20]. Each gene is represented as a dot. Edges are drawn as grey lines. Colored dots belong to the module that their color indicates and grey dots indicate all other genes in the network. (C-E) Scatter plots showing the relationship between gene group connectivity and essentiality for rRNA processing, protein synthesis and ubiquitin from the DD network respectively. On the y axis of these plots is the percentage of genes determined to be essential in yeast. The number of essential genes in each module/total number of genes in each module was: 196/390 = 50.3 (C), 122/441 = 27.7 (D), 50/222 = 22.5 (E). (F-H) Relationship between the average blastp score of a node and k for the same module members listed in C-E. On the y axis of these plots is the average log(e score) of genes within that bin. For plots C-H, the connectivity within each module for each gene was determined and each gene rank ordered by connectivity. 20 equal sized bins for each of the expression datasets were formed and the average connectivity of the genes in each bin plotted on the X axis.
Figure 4
Figure 4
A co-expression network of the Environmental Response dataset. For all panels in the figure: blue color represents members of the rRNA processing module, yellow color represents members of the protein synthesis module and red color represents members of the ubiquitin pathway. (A) A hierarchical clustering of the topological overlap matrix for the ER dataset. (B) A drawn network of gene co-expression from the ER dataset. A drawn network of gene co-expression from the DD dataset. Edges were computed from the Pearson correlation coefficients. Network structure was drawn in Pajek [20]. Each gene is represented as a dot. Edges are drawn as grey lines. Colored dots belong to the module that their color indicates and grey dots indicate all other genes in the network. (C-E) Correlation plots showing the relationship between gene group connectivity and essentiality for rRNA processing, protein synthesis and ubiquitin from the ER network respectively. On the y axis of these plots is the percentage of genes determined to be essential in yeast. The number of essential genes in each module/total number of genes in each module was: 317/929 = 34.1 (C), 98/323 = 30.3 (D), 18/37 = 48.6 (E). (F-H) Relationship between the average blastp score of a node and k for the same module members listed in C-E. On the y axis of these plots is the average log(e score) of genes within that bin. For plots C-H, the connectivity within each module for each gene was determined and each gene rank ordered by connectivity.
Figure 5
Figure 5
A co-expression network of the Cell Cycle dataset. For all panels in the figure: blue color represents members of the rRNA processing module, yellow color represents members of the protein synthesis module and red color represents members of the ubiquitin pathway. (A) A hierarchical clustering of the topological overlap matrix for the CC dataset. (B) A drawn network of gene co-expression from the CC dataset. A drawn network of gene co-expression from the DD dataset. Edges were computed from the Pearson correlation coefficients. Network structure was drawn in Pajek [20]. Each gene is represented as a dot. Edges are drawn as grey lines. Colored dots belong to the module that their color indicates and grey dots indicate all other genes in the network. (C-E) Correlation plots showing the relationship between gene group connectivity and essentiality for rRNA processing, protein synthesis and ubiquitin from the CC network respectively. On the y axis of these plots is the percentage of genes determined to be essential in yeast. The number of essential genes in each module/total number of genes in each module was: 154/300 = 51.3 (C), 105/398 = 26.4 (D), 38/312 = 12.2 (E). (F-H) Relationship between the average blastp score of a node and k for the same module members listed in C-E. On the y axis of these plots is the average log(e score) of genes within that bin. For plots C-H, the connectivity within each module for each gene was determined and each gene rank ordered by connectivity.
Figure 6
Figure 6
Module members retrieved from very different datasets are conserved. For all panels in the figure: black color represents modules retrieved from the DD dataset, blue color represents modules retrieved from the ER dataset, and green color represents modules retrieved from the CC dataset. In each panel A-C a different module is examined for overlap of its members in a Venn diagram. In each diagram the relative overlap of the various modules has been diagramed as different amounts of area with the count represented for each zone by a number that quantifies the precise number of matches.

References

    1. Hartwell LH, Hopfield JJ, Leibler S, Murray AW. From molecular to modular cell biology. Nature. 1999;402:C47–52. doi: 10.1038/35011540. - DOI - PubMed
    1. Barabasi AL, Oltvai ZN. Network biology: understanding the cell's functional organization. Nat Rev Genet. 2004;5:101–113. doi: 10.1038/nrg1272. - DOI - PubMed
    1. van Noort V, Snel B, Huynen MA. The yeast coexpression network has a small-world, scale-free architecture and can be explained by a simple model. EMBO Rep. 2004;5:280–284. doi: 10.1038/sj.embor.7400090. - DOI - PMC - PubMed
    1. Ravasz E, Somera AL, Mongru DA, Oltvai ZN, Barabasi AL. Hierarchical organization of modularity in metabolic networks. Science. 2002;297:1551–1555. doi: 10.1126/science.1073374. - DOI - PubMed
    1. Jeong H, Tombor B, Albert R, Oltvai ZN, Barabasi AL. The large-scale organization of metabolic networks. Nature. 2000;407:651–654. doi: 10.1038/35036627. - DOI - PubMed

Publication types