. 2006 Mar;10(3):303-15.
doi: 10.1016/j.devcel.2006.01.014.

Mislocalization of the Drosophila centromere-specific histone CID promotes formation of functional ectopic kinetochores

Affiliations

Mislocalization of the Drosophila centromere-specific histone CID promotes formation of functional ectopic kinetochores

Patrick Heun et al. Dev Cell. 2006 Mar.

Abstract

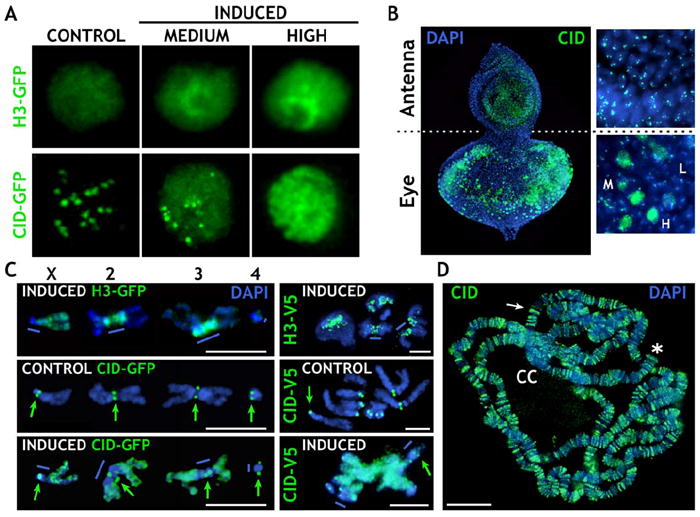
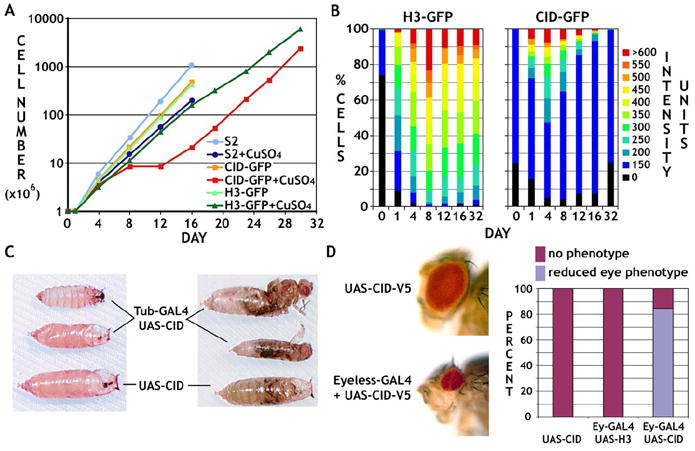
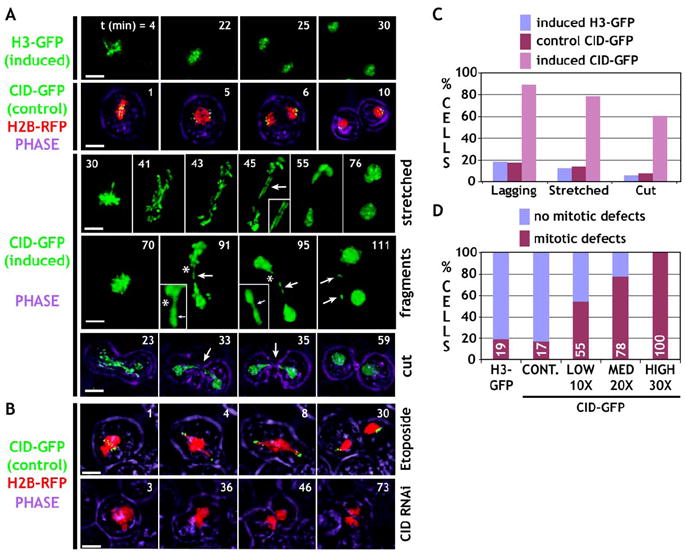
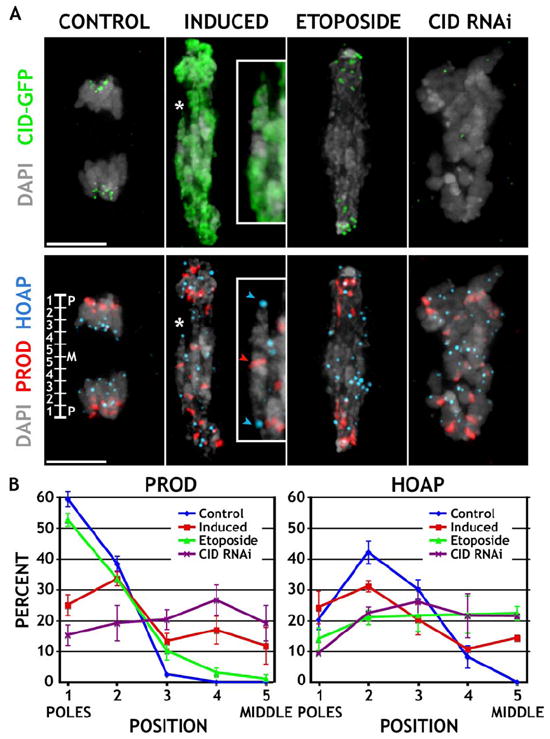
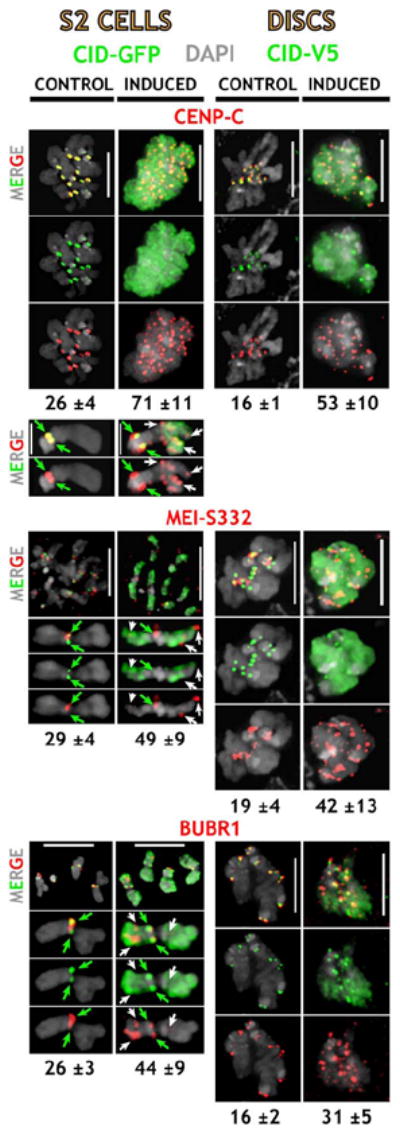
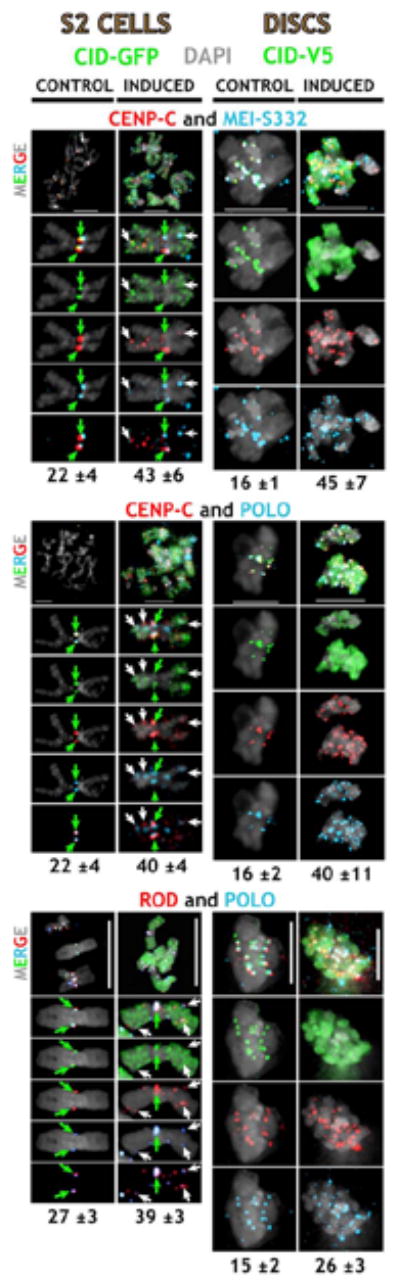
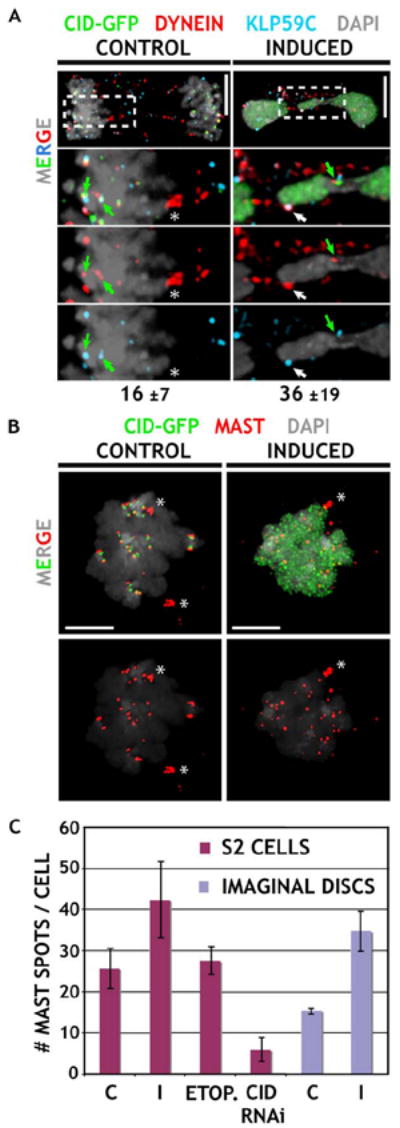
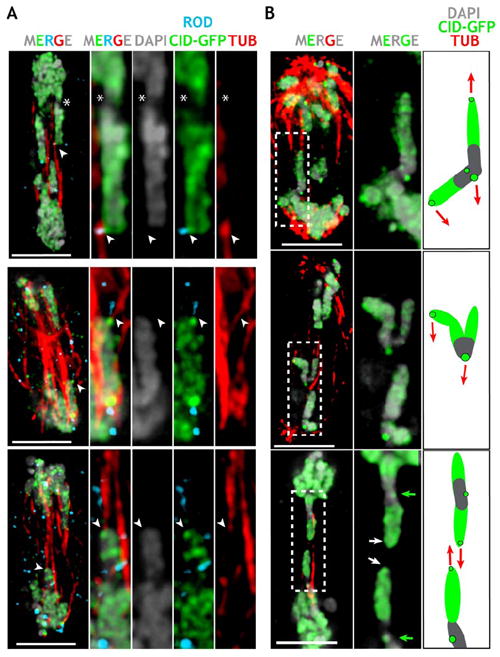
The centromere-specific histone variant CENP-A (CID in Drosophila) is a structural and functional foundation for kinetochore formation and chromosome segregation. Here, we show that overexpressed CID is mislocalized into normally noncentromeric regions in Drosophila tissue culture cells and animals. Analysis of mitoses in living and fixed cells reveals that mitotic delays, anaphase bridges, chromosome fragmentation, and cell and organismal lethality are all direct consequences of CID mislocalization. In addition, proteins that are normally restricted to endogenous kinetochores assemble at a subset of ectopic CID incorporation regions. The presence of microtubule motors and binding proteins, spindle attachments, and aberrant chromosome morphologies demonstrate that these ectopic kinetochores are functional. We conclude that CID mislocalization promotes formation of ectopic centromeres and multicentric chromosomes, which causes chromosome missegregation, aneuploidy, and growth defects. Thus, CENP-A mislocalization is one possible mechanism for genome instability during cancer progression, as well as centromere plasticity during evolution.


Figures

Figure 1
Figure 1. CID-GFP- or H3-GFP-Expressing S2 Cells Display Different Protein Levels and Localizations upon Induction
(A) H3-GFP staining was widely distributed in the nucleus at all levels of expression, whereas CID-GFP staining patterns depended on expression levels: centromere only, control; diffuse plus centromere, medium; and diffuse, high. (B) CID overexpression in animals carrying UAS-CID-V5. IF with anti-CID antibodies (green) on eye-antenna discs shows that the EY-GAL4 driver is very specific to the eye disc. The levels of CID varied from low (L), to medium (M), to high (H). Cells in the antenna disc display endogenous CID levels. (C) Distribution of H3-GFP/H3-V5 (top images) and low and high levels of CID-GFP/CID-V5 (green: GFP or V5 antibodies) on metaphase chromosomes from S2 cells (left), and from larval discs (right). High-CID-GFP/CID-V5 staining is predominantly euchromatic and at endogenous centromeres (green arrows), and it is not extensively incorporated into pericentric heterochromatin (blue bars), unlike H3-GFP/H3-V5. (D) CID (green) was abnormally incorporated into polytene chromosome arms, bands (white arrow), and telomeres (asterisk) after heat shock induction of larvae containing HSP70-GAL4 and UAS-CID-V5. Only low levels of CID-V5 were incorporated into the heterochromatic chromocenter (CC). The scale bars are 5 μm in (C) and 15 μm in (D).
Figure 2
Figure 2. CID Overexpression Results in Cellular and Organismal Phenotypes
(A) Growth curves are shown for untransfected or stably transfected S2 cells carrying CID-GFP or H3-GFP, with and without CuSO4 induction. Induced CID-GFP cells displayed significant growth defects from day 8 to 12. (B) H3-GFP-expressing cells maintained a similar distribution of protein levels once fully induced (~day 4), whereas the percentage of cells with CID-GFP levels above 150 decreased significantly after day 4. (C) Ubiquitous CID induction resulted in organismal lethality (96%, n = 305). The majority (76%) stopped developing before pupariation (left panel), and 20% metamorphosed but were unable to hatch (right panel). The few flies (4%) that hatched, as well as the unhatched pupae, were substantially smaller than control flies. (D) Eye-specific CID induction resulted in strongly reduced eye size (lower panel) in comparison to controls (upper panel). Approximately 85% of induced flies (n = 391) showed a severe visible phenotype (histogram).
Figure 3
Figure 3. Time-Lapse Analysis of Live S2 Cells Reveals Mitotic Defects after CID Induction
See the Supplemental Movies. (A) Frames from time-lapse microscopy are shown for induced H3-GFP, control CID-GFP coexpressed with H2B-RFP (chromosome counter stain), and induced CID-GFP. Phase indicates cell outlines. Control chromosomes segregate normally. In contrast, cells with induced CID-GFP expression displayed stretched chromosomes, fragmentation (asterisk, inset), and “cutting” of the unsegregated chromosome mass by cytokinesis (see [C] for quantitation). (B) Cells were treated with Etoposide to mimic problems in resolving sister chromatids (row 6), or they were depleted for CID by RNAi (row 7), and displayed distinct segregation defects in comparison to CID mislocalization. The scale bars are 5 μm. (C) Quantitation of defects observed in the time-lapse analysis. Cells induced for CID-GFP displayed higher percentages of all types of mitotic defects (induced nH3-GFP = 32, nCID-GFP control = 50, ninduced CID-GFP = 27). For all phenotypes, the differences were highly significant (p < 0.001, Chi square test). (D) Levels of CID-GFP expression correlated with a highly elevated overall frequency of defective mitoses, and all are significantly different from the controls (p < 0.01, in comparison to controls; H3-GFP: n = 32, control: n = 50, CID-GFP, low: n = 11, medium: n = 9 and high: n = 7).
Figure 4
Figure 4. CID Mislocalization Causes Mitotic Defects that Are Different from Failure to Separate Sister Chromatids or the Loss of Endogenous Centromere Function
(A) Induced S2 cells, and uninduced cells treated with Etoposide or depleted for CID (CID RNAi), were fixed and stained for CID (green), PROD (red), and HOAP (blue). The inset shows a frequently observed phenotype of a chromosome (asterisk) being stretched along its length axis, with the centromeres (PROD) positioned in the middle, and the telomeres (HOAP) facing opposite poles. The scale bars are 5 μm. (B) The distance of all PROD (endogenous centromere) and HOAP (telomere) foci from the two poles was measured, normalized to the length of the cell, and expressed as percent distance from the pole (see ruler, bottom left in [A]). Cells with induced CID expression had PROD spots positioned less frequently near the poles and fewer HOAP spots in the middle, compared to Etoposide treatment. Cells depleted for CID display random staining for both. Note that two of ten PROD spots per cell colocalized with HOAP and were omitted from the quantitation. Error bars are ±1 standard deviation from the average.
Figure 5
Figure 5. Induction of Ectopic CID Results in Aberrant Localization of Centromere and Kinetochore Proteins to Normally Noncentromeric Regions
Localization of the inner kinetochore protein CENP-C, the sister cohesion protein MEI-S332, and BUBR1. CENP-C, MEI-S332, and BUBR1 are in red; CID-GFP in S2 cells and CID-V5 in larval disc cells are in green. Enlargements of individual chromosomes of S2 cells are shown below; green arrows = endogenous centromeres, white arrows = ectopic sites. Normal centromeric localization of all three proteins was observed in controls. Upon CID induction, these proteins were abnormally localized to many noncentromeric sites, and the average number of sites (below) was significantly higher in induced versus control cells (p < 0.01, Tables S1 and S2). The scale bars are 5 μm.
Figure 6
Figure 6. Inner and Outer Kinetochore Proteins Colocalize at Sites of Ectopic CID Incorporation
Control and induced cells were simultaneously stained with CENPC/MEI-S332, CENP-C/POLO, POLO/ROD, or MEI-S332/BUBR1 antibodies. CID-GFP in S2 cells and CID-V5 in larval disc cells are in green, CENP-C and ROD are in red, and POLO and MEI-S332 are in blue. Enlargements of individual chromosomes of S2 cells are shown below. Inner and outer kinetochore proteins were often colocalized at ectopic sites (white arrows), in addition to the endogenous centromeres (green arrows). The average number of colocalization sites (below) was significantly higher in induced versus control cells (p < 0.01, Tables S1 and S2). The scale bars are 5 μm.
Figure 7
Figure 7. Distributions of Microtubule Motors and the Plus-End Binding Protein MAST Suggest the Presence of Functional Ectopic Kinetochores
(A) Localization of the motor proteins Dynein and kinesin KLP59C. Merged images for anaphase figures are shown on top, and enlargements are shown below. CID-GFP-expressing cells were stained for CID (green), Dynein, and KLP59C (blue). Control cells display close association of both proteins only at endogenous centromeres (green arrows), whereas they frequently colocalize at ectopic chromosomal sites (white arrow) after induction (average number of sites indicated below, see Table S1). Note that Dynein also decorates underlying spindle microtubules (asterisk). The scale bars are 5 μm. (B) Localization of the microtubule plus-end binding protein MAST. Metaphase figures from induced cells contain more MAST (red) spots than observed in controls. The scale bars are 5 μm. (C) Quantitation of MAST spots in S2 and imaginal disc cells. MAST signals associated with spindle poles (asterisk in [B]) were not included in the quantitation. Induced cells contained significantly elevated numbers of MAST spots compared to controls (p values in text). Etoposide treatment did not alter the number of MAST spots from control values, and CID depletion by RNAi resulted in significantly fewer MAST spots than controls (p < 0.001 for I or CID RNAi versus C; S2 cells: nC = 19, nI = 17, nETOP = 16, nCID RNAi = 14, imaginal disks: nC = 12, nI = 13). Error bars are ±1 standard deviation from the average.
Figure 8
Figure 8. Ectopic Microtubule Attachments and Aberrant Chromosome Morphologies Are Observed after CID Induction
(A) Anaphase figure from CID-GFP-expressing S2 cells (higher magnification to the right) displaying prominent ectopic CID-GFP foci (white arrows) connected to microtubule bundles (red), and colocalized with ROD (light blue), far from the endogenous centromere (asterisk). (B) Chromosome morphologies suggest poleward forces applied to chromosome arms after CID induction. The panel to the right shows enlargements of chromosomes, plus a schematic interpretation of the forces (red arrows) responsible for the observed chromosome morphologies. The scale bars are 5 μm.

References

    1. Agudo M, Abad JP, Molina I, Losada A, Ripoll P, Villasante A. A dicentric chromosome of Drosophila melanogaster showing alternate centromere inactivation. Chromosoma. 2000;109:190–196. - PubMed
    1. Ahmad K, Golic KG. The transmission of fragmented chromosomes in Drosophila melanogaster. Genetics. 1998;148:775–792. - PMC - PubMed
    1. Ashburner M. Drosophila: A Laboratory Handbook. Cold Spring Harbor, NY: Cold Spring Harbor Laboratory Press; 1990.
    1. Balmain A, Gray J, Ponder B. The genetics and genomics of cancer. Nat Genet. 2003;33(Suppl):238–244. - PubMed
    1. Basto R, Gomes R, Karess RE. Rough deal and Zw10 are required for the metaphase checkpoint in Drosophila. Nat Cell Biol. 2000;2:939–943. - PubMed

Publication types

MeSH terms